

By Christoph Schon and Olivier d’Assier
On September 24, House Speaker Nancy Pelosi launched impeachment proceedings against President Donald Trump. The US market initially fell on the news, only to recover all of its losses the next day. Unlike the threat of impeachment proceedings in May of 2017, ruled out by Pelosi then, this time it’s for real[1]. So, what might investors expect from this development and, more importantly, how might they best respond?
We used the Axioma Risk Platform to model a series of stress tests designed to guide investors through this risk event. As we noted in 2017, presidential impeachments are notoriously difficult to model because they play out over such a prolonged time frame and by the time the legal decision is confirmed (by votes in both the House and the Senate, and perhaps this time by the House again), it has been well discounted by market participants. We would therefore expect the results of our stress tests to represent the losses/gains that investors might incur during the early part of the proceeding as the implications of the event gather in their collective consciousness.
As we have seen time and time again in the last few years, increases in uncertainty from geopolitics cause a rush of investors out of equities and into US treasuries. We would expect a number of them to find this news disturbing enough to repeat this trade. For this reason, we are starting our stress test with a shock to the US 10-Year bond yield of 50 bps. We first ran this simple transitive stress test calibrating the correlations used to reprice all other assets on the period of the first impeachment talks—February 24 to May 19, 2017. We then ran it again with the current correlation regime, using the last 60 days for the calibration. We then added a second factor shock by depreciating the USD via the Dollar Index by 4% and ran this transitive stress test on both correlation regimes. Finally, we added a third factor shock by forcing the S&P 500 index down by 8%[2].
The table below summarizes the results for the one, two, and three factor shock scenarios over the two different correlation regimes (2017 and current) for a number of broad indices and asset classes. The results are displayed as % change in present value of each index and are reported from a USD perspective.
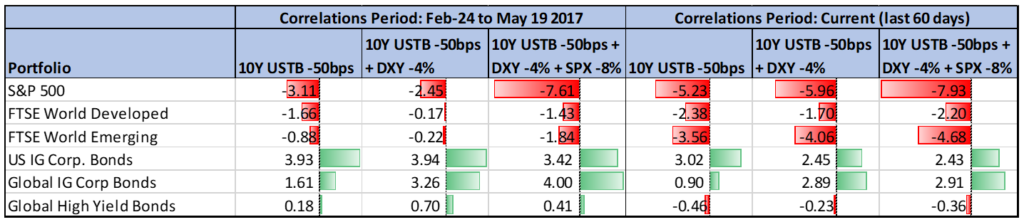
Not surprisingly, equity indices all suffer losses, while investment-grade corporate bonds all benefit from the flight to safety. Emerging markets suffer more under the current correlation regime than they did using 2017 correlations. High Yield bonds seem relatively unaffected by these scenarios, regardless of the correlation regime used.
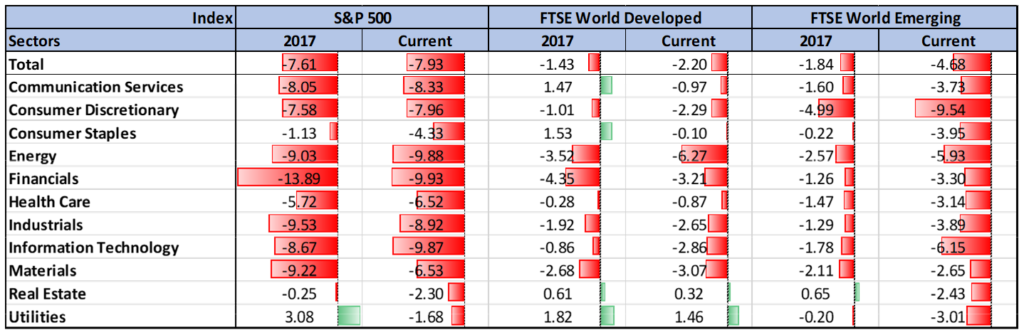
The table below focuses on the equity indices and the three-factor scenario under the two different correlation regimes, at the (GICS) Sector level. Recall that one of the three factor shocks in this scenario is the S&P 500 index down 8%. This is reflected in the Total row for the S&P 500 index results, but note how much more sensitive the Financials sector is to this scenario, especially if we use the 2017 correlation regime (+82% for 2017 vs +25% for Current). Most cyclical sectors get hit hard, while Utilities, Real Estate, and Consumer Staples come out relatively unscathed. There was more sector diversification in 2017 than currently across all three indices. Losses for the emerging market index were 2.5 times bigger under the current correlation regime than in 2017. Meanwhile for the global index, differences across correlation regimes are much more nuanced. Financials and energy sectors are still the two biggest losers, even though they trade places.
What can investors do to protect themselves from these possible outcomes? We ran the same stress test on a series of STOXX Parent Indices with corresponding minimum-variance indices. The table below summarizes these results showing the parent index versus the unconstrained version of the corresponding minimum-variance index[3].
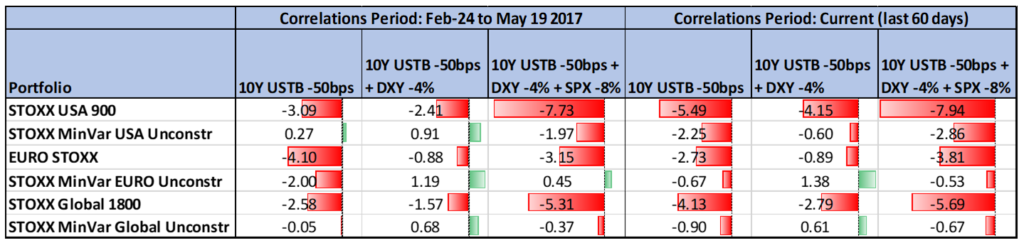
In each of the cases, minimum variance was able to deliver its promise of lower risk and therefore lower losses. We note again that there must have been more diversification available across equity markets in 2017 than currently, since the minimum-variance indices achieved a greater loss-minimization on the scenario, including the equity market shock (S&P500) using the correlation regime from that year. Similarly, the losses for the parent index of the Eurozone and Global equity markets were larger in 2017 than today based on their correlation with the S&P500. The differences in outcomes between the parent index and their minimum-variance counterparts for these scenarios are quite significant and should appeal to any investor wishing to remain in the equity asset class, but not able to stomach the volatility that impeachment proceedings bring.
[1] We previously wrote about this potential event here when the possibility was first raised in May 2017.
[2] We estimated the betas of the dollar index and S&P 500 versus the yield change by looking at scatter plots of daily returns over our calibration period (24-Feb-2017 to 19-May-2017).
[3] Note that STOXX offers both a constrained and an unconstrained variant of these minimum-variance indices.


