

By Wanja Eichl and Joachim Plath,1 Finreon
The growing popularity of smart-beta products has fueled the debate around whether their advantages and potential performance can prevail across different market environments.
The theoretical foundation of smart beta emerged over the past 30 years. Academic research has identified factors — besides the market risk — that can achieve excess returns over the long term. For example, Nobel Prize winner Eugene Fama showed that shares of small companies (size factor) and cheap stocks (value factor) systematically beat the market and can better explain stock returns.
Later on, additional sources of excess returns were uncovered. Nowadays, the generally accepted ones besides the classical market factor include the size, value, momentum, residual momentum, reversal, low risk, and quality factors.
Multi- and single-factor performance
Supporters of smart beta highlight the diversification aspect of combining different factors, which reduces the risk of their portfolio compared to the benchmark. By investing in a systematic way without the need for human judgment, smart beta is also far cheaper than its actively managed counterparts. On the other hand, opponents claim that single factors have long phases of underperformance and relatively high rebalancing costs.
Indeed, 2018 was a tough year for the European stock market — including smart beta solutions. The EURO STOXX® Index had a total return of –12%2, while the EURO STOXX® Multi Premia® Index — which combines the above-mentioned seven factors into a single portfolio — returned –10%.
The EURO STOXX Multi Premia and Single Premium Indices integrate the academic research-based Multi Premia methodology developed by Finreon, a spin-off from the University of St. Gallen in Switzerland. The indices track the seven distinctive sources of equity risk and returns referred to earlier.
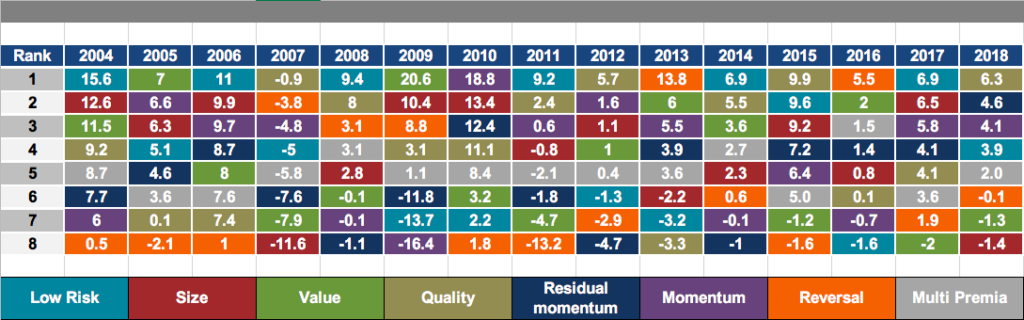
Figure 1 below shows that no individual factor strategy dominates consistently. In a volatile phase such as in 2018, quality and low-risk stocks, well-known for their defensive characteristics, outperformed by 6.3 percentage points and 3.9 points, respectively. On the other hand, value and reversal stocks, which are described as countercyclical, slightly underperformed the market.
Figure 1: Factor diversification in practice
Drawdown risk
The distribution of returns in Figure 1 highlights an essential aspect of the EURO STOXX Multi Premia Index: its diversification across single-factor returns. By weighting each single-factor portfolio in such a way that they contribute equally to the tracking error of the whole portfolio, the single-factor performance gets systematically diversified. This translates into a smooth outperformance in the long run.
From 2004 through 2018, the EURO STOXX Multi Premia Index delivered an annual return of 8.3%, outperforming the EURO STOXX Index by a geometric annual average of 2.8%. This was achieved without the volatile ups and downs of single-factor strategies, as displayed by the more consistent ranking of the gray boxes in Figure 1.
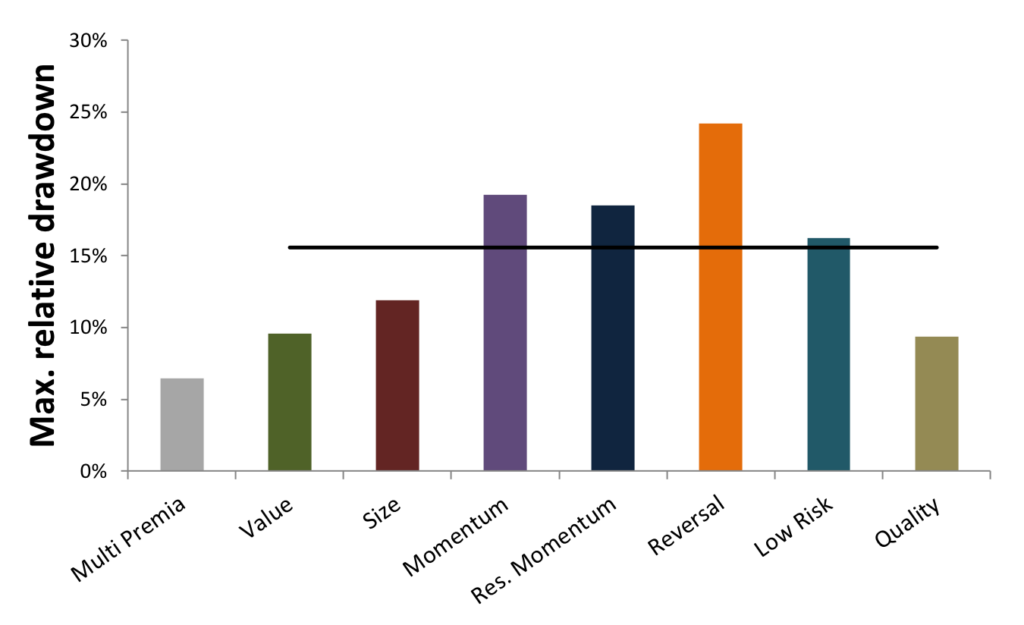
Moreover, the EURO STOXX Multi Premia Index’s factor diversification substantially reduces its risk of underperformance relative to the EURO STOXX Index. To quantify the diversification potential of systematic factor investing, Figure 2 highlights two important measures of a portfolio’s risk profile. The left panel shows the underperformance probability of each factor and the Multi Premia portfolio vis-à-vis the benchmark, over a one-year period. The right panel tracks the relative drawdown, which measures the maximum loss an investor has faced relative to the benchmark.
The Multi Premia solution has an underperformance probability3 that is far below the average for the single-factor portfolios. This means that factors do not perform in line, and that their underperformance doesn’t occur at the same time but is rather distributed over different phases. When some factors are in a weak stage, others tend to be strong, helping to mitigate the overall negative returns.
Figure 2: Relative risk profile of factor portfolios
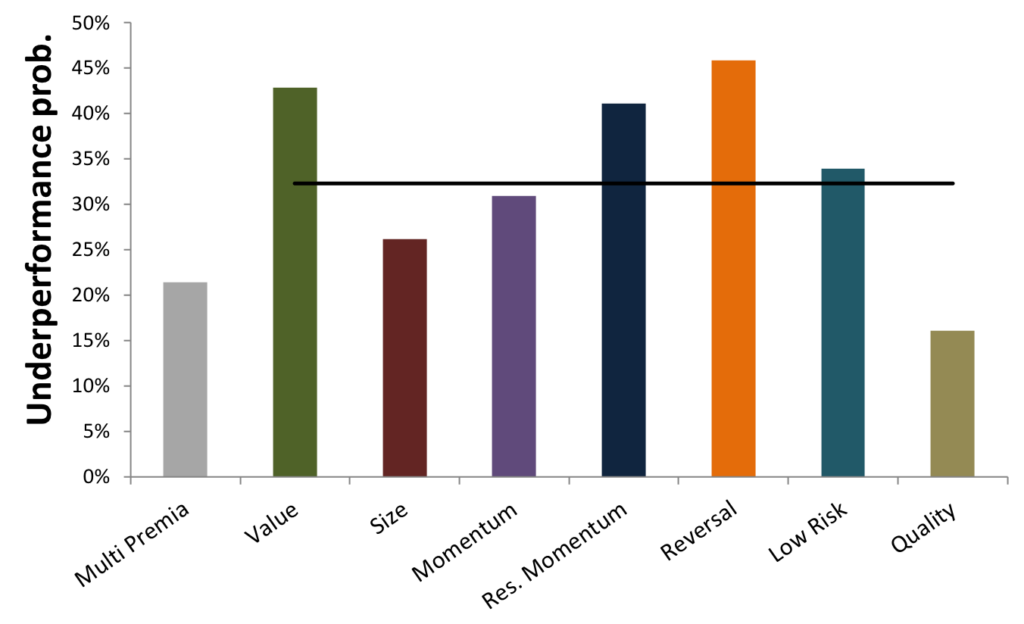
This analysis shows an average underperformance probability for the single factors of 32.3% over a one-year horizon relative to the EURO STOXX Index, as marked by the black transversal line in the first chart. Reversal stocks tend to underperform with a probability of 45.8% over the same horizon, the group’s highest reading.
For the maximum relative drawdown compared to the benchmark from 2004-2018, the analysis shows that reversal stocks exhibit the highest relative drawdown, while the quality factor had the smallest drawdown.
Consistent with the previous findings, the EURO STOXX Multi Premia Index benefits from the different drawdown profiles of the individual factor portfolios. Instead of tail risks occurring collectively, these extreme events occur in an asynchronous manner for the single factors. Speaking in numbers, the EURO STOXX Multi Premia Index’s relative drawdown is 6.5%, whereas the factor average is 15.6%.
In summary, the EURO STOXX Multi Premia Index overcomes the risks of single-factor investments via the power of diversification. Due to the asynchronous distribution of each factor’s risks and returns, the EURO STOXX Multi Premia Index is a valuable addition to an investor’s portfolio.
Featured Indices
- EURO STOXX® Multi Premia® Index
- EURO STOXX® Value Premium Index
- EURO STOXX® Size Premium Index
- EURO STOXX® Momentum Premium Index
- EURO STOXX® Residual Momentum Premium Index
- EURO STOXX® Reversal Premium Index
- EURO STOXX® Low Risk Premium Index
- EURO STOXX® Quality Premium Index
- EURO STOXX® Index
1 Mr. Eichl is Co-Head of Business Development at Finreon AG. Mr. Plath works in Investment Solutions at Finreon.
2 Total returns in euros.
3 The underperformance probability is estimated by counting the days on which each factor exhibited negative relative returns compared to the benchmark over the period of one year, divided by the total number of days in that year.


