

In June, Qontigo introduced the STOXX® Paris-Aligned Benchmark Indices (PABs) and STOXX® Climate Transition Benchmark Indices (CTBs), which comply with, and exceed, the requirements laid out in the new European Union Climate Benchmarks regulation.
Last week we reviewed a research paper1 from Qontigo that looks in depth into the regulatory background, methodology, and carbon emission and returns analysis of the STOXX Paris-Aligned Benchmark Indices with specific focus on the STOXX® Europe 600 Paris-Aligned Benchmark Index (STOXX Europe 600 PAB Index). A new report2 now delves deeper into the performance characteristics of this European index.
The study looks into the returns and risk profile of the STOXX Europe 600 PAB Index and provides a factor and performance attribution analysis. The conclusions tell us about the performance of low-carbon portfolios at a time when they are gathering assets amid increasing regulation, client demand, and heightened risk-management considerations. For more information on the new STOXX PAB and CTB Indices, visit our recent article here.
Better risk-return profile
Figure 1, taken from the latest report, shows the performance of the STOXX Europe 600 PAB Index portfolio and that of its benchmark, the STOXX® Europe 600 Index, in backtested data from March 2018 through June 2020. Figure 2 displays the relative, or active, performance of the former against the latter.
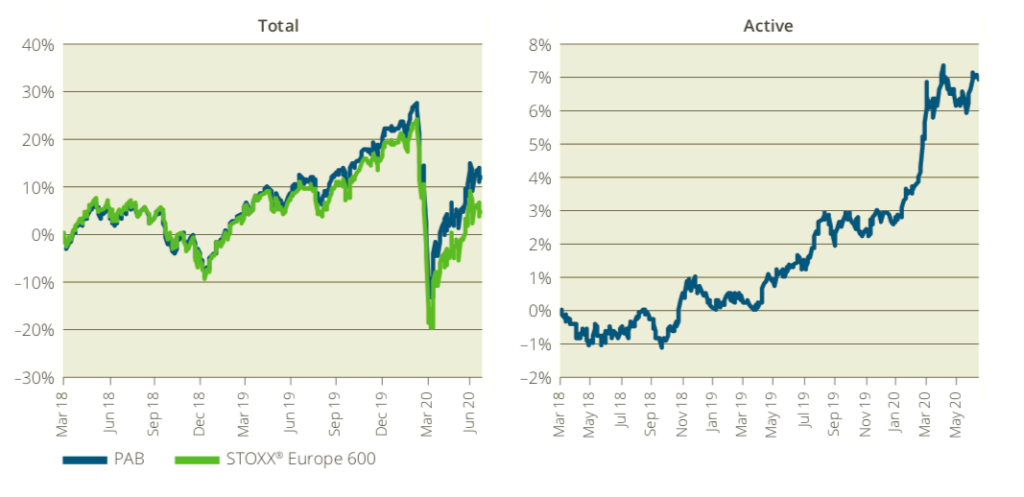
Source: Qontigo, gross returns in euros, Mar. 19, 2018 – Jun. 30, 2020
Since March 2018, the STOXX Europe 600 PAB Index has cumulatively outperformed its benchmark by 7 percentage points. Its relative returns have been particularly strong this year amid the COVID-19-triggered market volatility.
The outperformance also came with lower risk, as the study notes that annualized volatility for the STOXX Europe 600 PAB Index during the entire period was 18.7%, compared with 19.9% for the benchmark. Moreover, the STOXX Europe 600 PAB Index shows a relatively low 2.4% realized tracking error, producing an information ratio of 1.2 compared to its benchmark index.
Active risk and returns
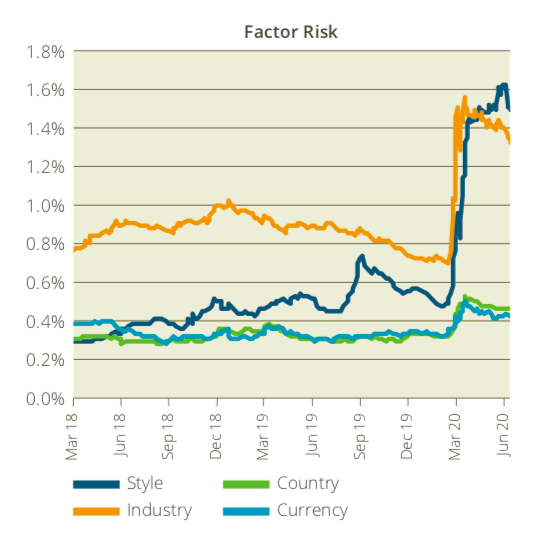
The STOXX Europe 600 PAB Index’s predicted active risk shot up in February this year, doubling to almost 3% from a historical level closer to 1.5%, according to the study.
“The active risk of many other portfolios did the same, driven by higher volatilities for most underlying risk factors plus substantial changes in correlation,” wrote Melissa Brown, Head of Applied Research at Qontigo and author of the report.
Looking into risk factors, industry and style have been the key drivers of the STOXX Europe 600 PAB Index’s active risk and returns. An overweight in pharmaceuticals and an underweight in energy companies — both accretive to extra returns — stand out among active industry exposures.
Style risk has also come into play in both active exposure and contribution to active risk. The PAB index maintained a negative exposure to market sensitivity (in other words, it had a tilt toward low-beta stocks) over time. However, this exposure became even more negative suddenly and substantially last February.
All and all, Brown writes that the predicted active risk of the STOXX Europe 600 PAB Index has been and remains relatively low, and that it has been driven mainly by risk model factors (particularly industries) as opposed to the inclusion or exclusion of specific stocks. More on this later. Figure 2 displays the aggregate impact of those factors in the active risk of the index.
Performance attribution
Like risk factors, performance attribution also points to positive returns from the active industry and style exposures. Figure 3, an excerpt from a more complete table in the report, shows the contribution from active risk factors every year.
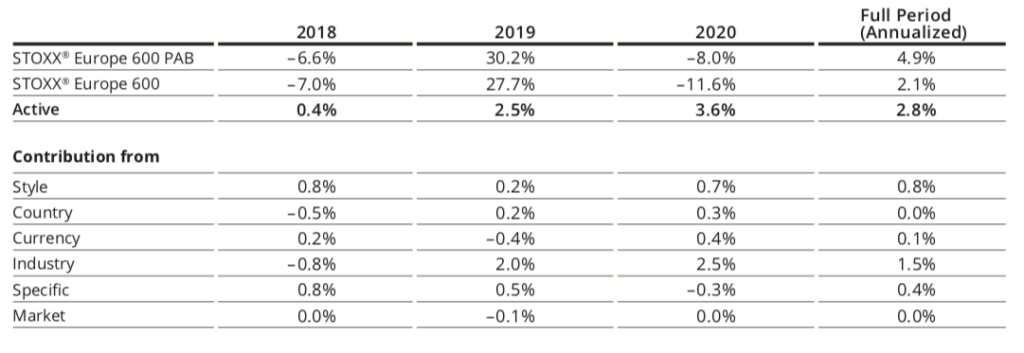
The study then presents a deeper analysis into the contributors to each one of style, country, currency, industry, specific and market factors.
Generally positive stock-specific returns
Drilling down into the active risk components, the study reveals few large active exposures in the STOXX Europe 600 PAB Index. They have in turn translated into many small (usually positive) contributions to the relative return, with no factor having an outsized impact.
While small, the stock-specific portion of both risk and return — which are those that cannot be explained by factors — was generally positive.
“The findings suggest,” Brown said in an interview, “that over time, stocks offering a better climate profile have idiosyncratic characteristics that can enhance returns beyond their industry, country or style factor exposures.”
Within style, profitability was the biggest single contributor to returns over the entire period.
“It’s also noteworthy that the screens applied to form the low-carbon portfolio,” adds Brown, “seem to push weight onto more profitable companies.”
We invite you to download the study and find out more.
Featured indices
STOXX® Paris-Aligned Benchmark Indices
STOXX® Climate Transition Benchmark Indices
STOXX® Europe 600 Paris-Aligned Benchmark Index
1 Keogh, W., Cheung, A., Taddei, N., Tesfaldet, H., Kaloudis, I., ‘An Introduction to the STOXX Paris-Aligned Benchmark Indices,’ Qontigo, June 2020.
2 Brown, M., ‘The STOXX Europe 600 Paris-Aligned Benchmark: A Better Path to Success?’ Qontigo, June 2020.


