

Qontigo this year introduced a family of sustainability indices that offers three distinct ESG alternatives to the STOXX® USA 500 benchmark: the STOXX® USA 500 ESG Broad Market, STOXX® USA 500 ESG Target and STOXX® USA 500 ESG Target TE.
A new whitepaper1 from Diana R. Baechle, PhD, Principal, Applied Research at Qontigo, dives deep into the risk, return and impact profile of each one of the three ESG indices, facilitating a full analysis that may help investors in their adoption of sustainable index-based portfolios.
Headline returns
One first finding is that all three ESG indices, as expected, attained better ESG scores than the benchmark throughout the period considered in the study. This was true even as the STOXX USA 500 benchmark’s own ESG score has increased consistently in recent years. A second observation that may be of interest to many investors is that all three indices’ returns and risk profiles over the period didn’t materially diverge from those of the benchmark.
Yet, beneath the surface the indices differ in their active risk and in key criteria such as sector allocation and factor exposure, a result of their varied construction methodology and targeted sustainability penetration. Investors need to consider these features as they gauge their optimal point in the trade-off between a higher ESG score and active risk.
Three different approaches
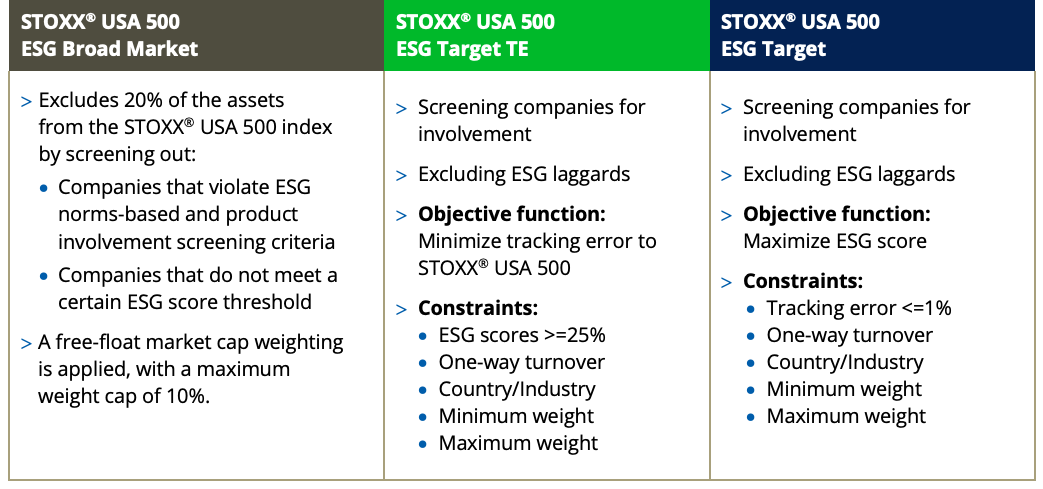
The ESG Broad Market index applies a set of compliance, product involvement and ESG performance exclusionary screens until only the 80% top ESG-rated constituents from the starting STOXX USA 500 universe remain.
From the ESG Broad Market selection pool, the ESG Target and ESG Target TE indices are built using the Axioma Portfolio Optimizer. The ESG Target’s objective is to maximize the portfolio’s ESG score while constraining its tracking error to the STOXX USA 500. On the other hand, the ESG Target TE’s goal is to minimize the tracking error while obtaining the highest possible ESG score.
Figure 1 describes the three indices’ strategy in more detail.
Figure 1 – Sustainable indices’ framework
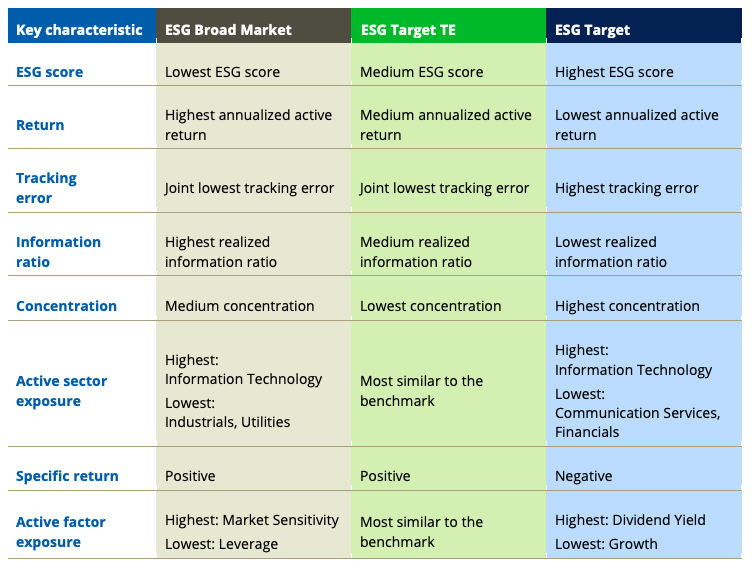
All three ESG variants have delivered as expected in terms of having higher ESG scores than the parent index and low tracking errors (Figure 2). The ESG Target index has provided the highest ESG score, but also has the highest tracking error (as well as lowest realized information ratio, fewest holdings and highest stock concentration). Although higher than that of the benchmark, the ESG Broad Market’s ESG score is the lowest among the three indices, but its tracking error is also the lowest (at par with that of the ESG Target TE). The ESG Target TE index falls somewhere in between ESG Target and ESG Broad Market with respect to most criteria.
Figure 2 – Summary of findings
Risk and returns
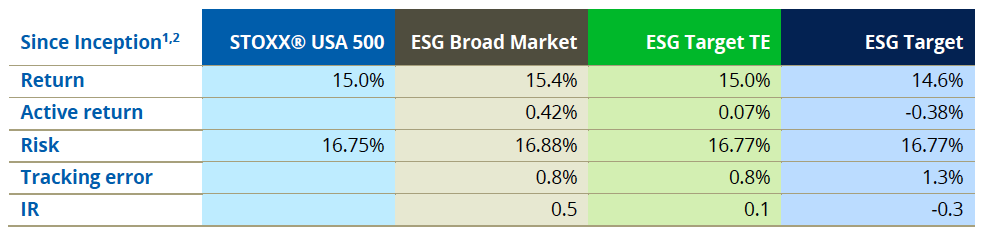
Turning to risk and performance, Figure 3 shows that the STOXX USA 500 and its ESG iterations produced similar returns between Mar. 19, 2012 and May 17, 2021 (the period under study). The ESG indices outperformed the benchmark in some years and lagged in others, the analysis separately shows, suggesting that performance patterns for each ESG index may vary across periods.
Interestingly, the realized total risk was similar across the ESG indices and the parent benchmark.
Figure 3 – Risk and return overview
Key characteristics
The whitepaper also shows that all three ESG portfolios had, broadly speaking, a sector allocation distribution that resembled that of the parent benchmark. There were, however, allocation deviations of up to 3 percentage points in some instances.
Additionally, the author runs a factor exposure and factor contribution analysis on all three portfolios, looking at specific return, industry, market and style factor contributions. In terms of factor exposures, all three ESG variants had negative exposures to the Growth and Volatility style factors.
The study is completed with evaluations of stock concentration, sector selection and allocation effects, performance of overweighted vs. underweighted shares, and correlations within the strategies.
Trade-off between risk and impact
In summary, the STOXX USA 500 ESG Broad Market, ESG Target and ESG Target TE indices provide options for sustainable investing designed to satisfy different investment mandates, Baechle writes in the whitepaper. The study will help paint a more complete picture of the three distinctive ESG portfolios and illustrate the varied approaches that sustainable investing can take.
We invite you to download and read the whitepaper by clicking here.
1 Diana Baechle, ‘Three Different Flavors of Sustainable Investing in the US,’ Qontigo, June 2021.


