

President Trump’s trade tactics with China rely on its bigger economic dependence on exports to the US than the US’s reliance on exports to China. Without getting into the merits of the numbers, or the wisdom of the strategy itself, investors seem to have added one more deficit to the US-China story; a risk deficit.
A look at charts 6 & 7 of the US and China Equity Risk Monitors1 respectively, highlights the deficit in question both in terms of predicted volatility (by all four of our risk model variants) as well as median pairwise asset-to-asset correlation for the Russell 1000 and the CSI 300 (and superimposes risk on the cumulative return of the benchmarks, shown in the grey sand chart).
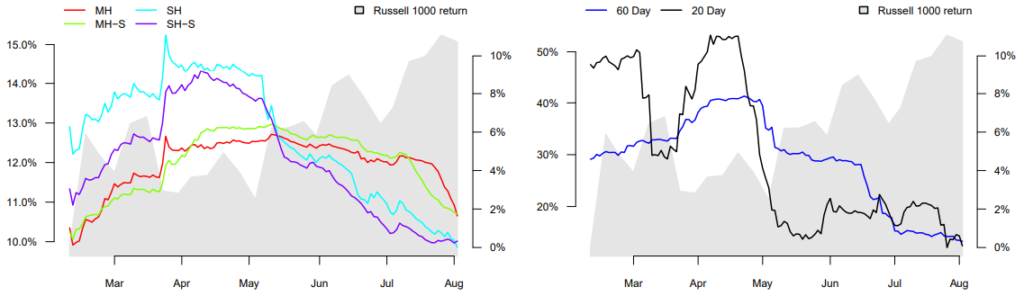
Both the fundamental and statistical short-horizon models predict lower volatility for the Russell 1000 than they did before the first batch of tariffs were announced on March 22nd. The medium-horizon model forecasts are still higher than their March lows but are coming down fast. Meanwhile pairwise correlation across assets in the US benchmark are at their lowest in a long time, providing ample diversification benefits to portfolio managers in that market.
Predicted Volatility (left) and rolling average pairwise asset correlations (right) for the Russell 1000
Contrast the above risk picture with the equivalent charts for the CSI 300. The (very) short period of ‘détente’ in late May when China made the offer to buy substantially more US crude oil and soybean, is clearly visible – both in terms of volatility and correlation – but was evidently short-lived. As new tariffs were announced (from both sides), volatility and correlation shot up again and have remained high ever since.
1Links to the US Risk monitor here and the China risk monitor here.
Predicted Volatility (left) and rolling average pairwise asset correlation (right) for the CSI 300
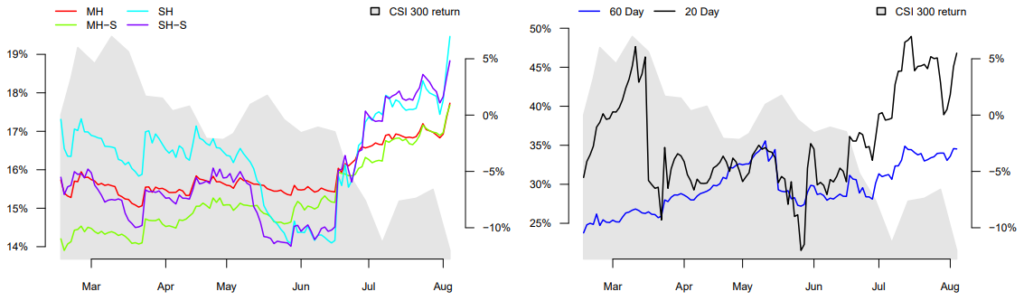
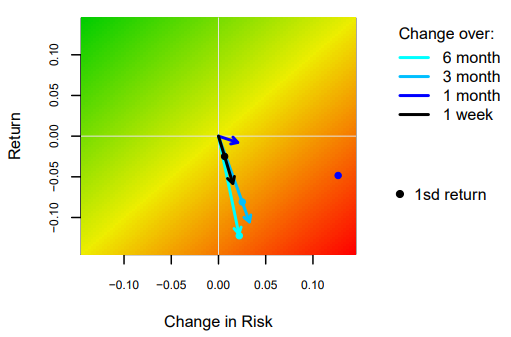
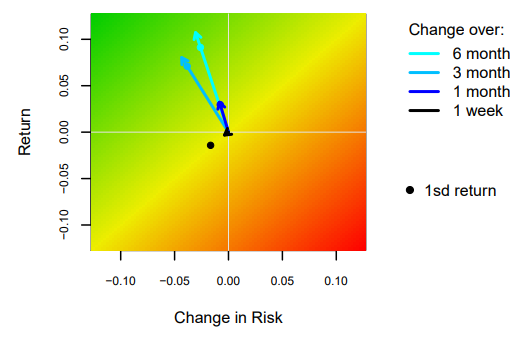
Chart 10 in the risk monitors summarizes the change in the risk-return environment faced by investors over the past one week, one, three, and six months for the Russell 1000 (left) and the CSI 300 (right). US market investors have enjoyed a Goldilocks market with declining risks and increasing returns over the past six months. In contrast, investors in the Chinese market have encountered rising volatility and negative returns. Those returns were even more negative for a USD based investor when adding the currency impact of a declining Yuan.
Change in risk versus total return for the Russell 1000 (left) and CSI 300 (right)
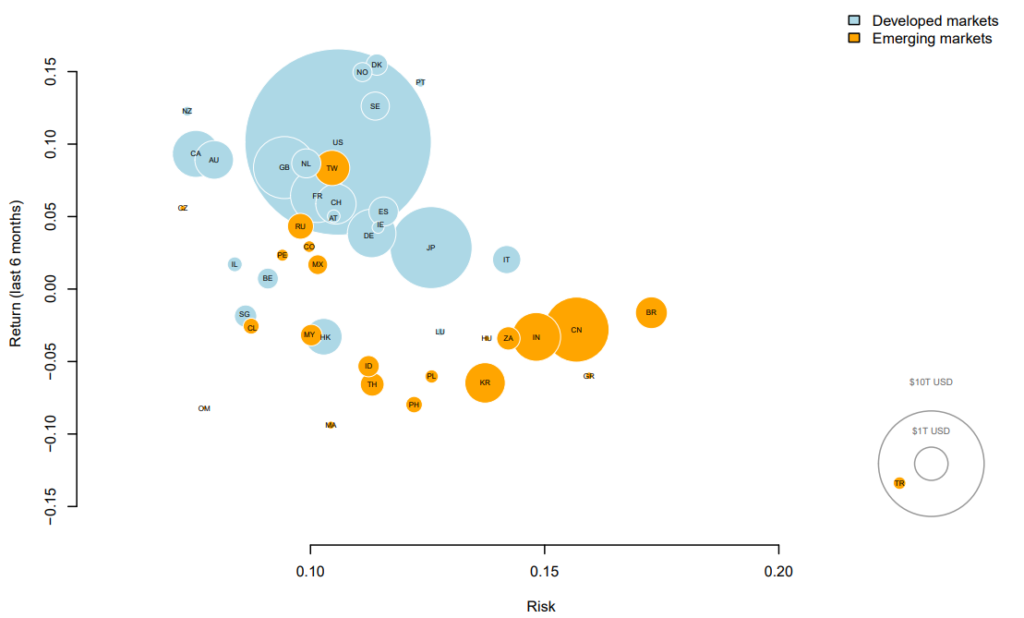
The global supply chain being as complex as it now is, the impact of the US-China relationship isn’t limited to just those two countries. Take a look at chart 5 in any of the Risk Monitor reports to see how the traditional risk-reward trade-off between developed and emerging markets has been turned upside down over the last six months. Riskier emerging markets are returning a lower risk-premium than their lower-risk developed counterparts; even with the current potential for a no-deal Brexit scenario.
Global Markets Risk and Return2
And so, it would seem that on a range of risk metrics, the first round in this Trumponomics bout with China goes to the US. But what goes around often comes around and as we head into round two, beware of any boomerang effect on the US economy spooking investors (and voters). As we have seen recently with Facebook and Netflix, there is plenty of downside risk in the US market and if correlations head north (there isn’t really any where else for them to go from here!), those losses can get magnified in a hurry.
2Total return over the last 6 months (y axis) vs current market volatility (x axis) estimated by Axioma short horizon world model, based on the Axioma estimation universe. Circle size represents market cap


