

The ROOF portfolios use the sector ROOF Scores to construct sentiment-tracking portfolios designed to capture the returns from the implementation of a bullish or bearish strategy. The Risk-On and Risk-Off portfolios are constructed from the holdings of the STOXX® USA 500 parent index and are rebalanced monthly (at month-end) using the then-current sector ROOF scores for the US market.
The first quarter of 2023 was an eventful one. Investor sentiment started the year building on the positive momentum from five consecutive months of a drop in headline inflation that saw the US ROOF ratio rise from a very bearish low of -1.121 on Oct. 19, 2022, to a neutral position at 0.06 on Jan. 1. Released in early January, the December CPI data showed a sixth month of decline in inflation, while news came of a weaker-than-expected Christmas shopping season. This softening in the macro picture gave investors hope that the Federal Reserve would soon end its rate-hiking cycle and pivot to a more dovish stance, with an eye on avoiding a hard landing for the economy in 2023. Investor sentiment rose in January to reach a bullish high of 1.122 on Feb. 3, 2023. Following this move, macro data for January, released in early February, highlighted a more resilient economy than investors had anticipated, dampening the hopes of an early Fed pivot, and driving sentiment back down to neutral over the course of the month, with the ROOF ratio ending at 0.30. The events of March, with the failure of Silicon Valley Bank (SVB) and Signature bank, and the rescue of First Republic Bank, spooked investors who were focused on the risk to the economy from the Fed’s ultra hawkish monetary policy and had not anticipated risks to the balance sheet of the lifeline of the economy — the banking sector. The crisis of early March drove sentiment further down to the edge of the bearish zone, with the ROOF ratio ending the month at -0.46, despite a positive month for the STOXX® USA 500 index on the back of a quick and decisive intervention by regulators to prevent systemic risk to the banking sector. Investor sentiment in March was driven more by the fear of risk contagion and unknown unknowns than assurances from the US Treasury that the crisis had been contained.
Breaking down the numbers for the quarter
A positive or bullish investor sentiment translates into higher demand for risk-tolerant assets as more investors implement a ‘risk-on’ strategy, which in turn drives up their price (the standard supply-and-demand economics are in play here). Conversely, when sentiment is negative or bearish, the demand for risk-averse assets rises as more investors implement a ‘risk-off’ strategy, driving up the price of those assets. When sentiment is neutral, the demand for risk-tolerant and risk-averse assets is said to be at equilibrium, both being equally attractive to investors.
During the 62 trading days of Q1 2023, investor sentiment was bullish (ROOF ratio >+0.5) for 20 days, positive (ROOF ratio between 0.2 and 0.5) on 18 days, neutral (ROOF ratio between 0.2 and -0.2) for 20 days, negative (ROOF ratio between -0.2 and -0.5) during 4 days, and was never bearish (ROOF ratio below -0.5). This means that investors were either positive or bullish almost two-thirds of the time (61.3%) during the quarter, fueling demand for risk-tolerant assets. Risk-averse assets, on the other hand, were only more popular than risk-tolerant assets during the four days when sentiment was negative, with the twenty days of neutral sentiment depicting a balanced supply and demand for risk by investors.
STOXX USA 500 ROOF portfolios – Q1 2023
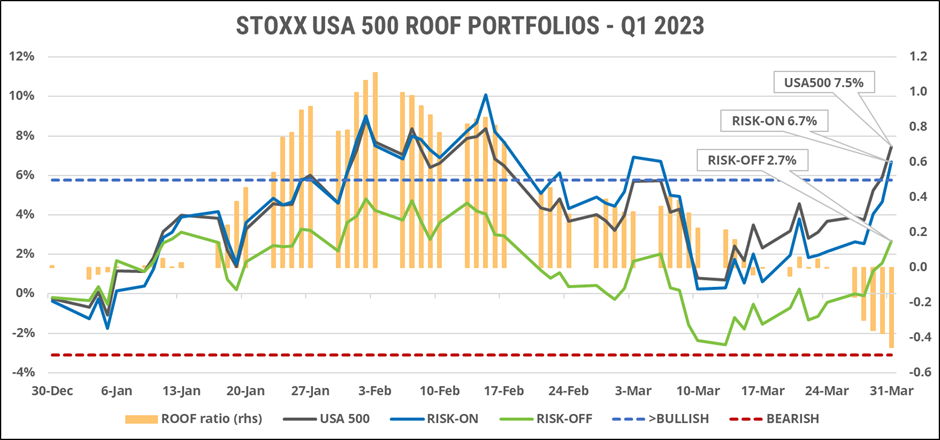
The chart above shows the cumulative return of the STOXX USA 500 index (black line), the Risk-On portfolio (blue line) and the Risk-Off portfolio (green line), during the first quarter. The orange bars are the daily ROOF ratio values. As mentioned previously, sentiment first rose in January, then declined in February, and finally fell through in March after the banking crisis. As sentiment rose in January, the Risk-On portfolio outperformed both the parent index as well as its Risk-Off counterpart. Until the eve of the SVB failure, the Risk-On portfolio was the best-performing of the three. That all changed after March 8, when SVB announced it would book a USD 1.8 billion loss from the sale of investments to cover increasing withdrawals. In the next three days, as the ROOF ratio declined from 0.4 (positive) to 0.2 (neutral), the Risk-On portfolio fell by 4.5% while the Risk-Off portfolio declined by a smaller 2.6%. The parent index, the STOXX USA 500, dropped 3.2% over the three days.
The swift regulatory response to the crisis reassured investors and created a bargain-hunting opportunity for short-term traders. Over the next 15 trading days of March, the parent index rose by 6.6%, the Risk-On portfolio by 6.4%, and the Risk-Off portfolio climbed only 5.1%. Sentiment meanwhile continued to decline with the ROOF ratio falling 0.2 to -0.46 by the end of the month.
For the full quarter, given the preponderance of trading days with a positive or bullish sentiment, the Risk-On portfolio outperformed the Risk-Off portfolio. However, due to bigger drawdowns during the days of the banking crisis, the Risk-On portfolio did not outperform the parent index over the quarter, ending just 0.8% below the STOXX USA 500.
What if you were bearish the whole time?
As we wrote in our ROOF Portfolio recaps for 2021 and 2022, sentiment has been negative or bearish most of the time since February 2021, when inflation first rose its ugly head, proving the Fed’s policy was largely misplaced and costing investors dearly. In the two years since then, the Risk-Off portfolio has outperformed both its Risk-On counterpart and the parent benchmark. It is conceivable that large institutional investors with quarterly strategy review cycles would have maintained their defensive outlooks for Q1 2023.
In the chart below we compare the performance of three defensive strategies during the first quarter of this year. They are the Risk-Off portfolio (green line), the Invesco S&P 500 Low Volatility ETF (SPLV) (red line) and the iShares MSCI USA Min Vol Factor ETF (USMV) (magenta line). The parent benchmark is shown in the black line.
STOXX USA 500 Risk-Off Portfolios VS SPLV and USMV – Q1 2023
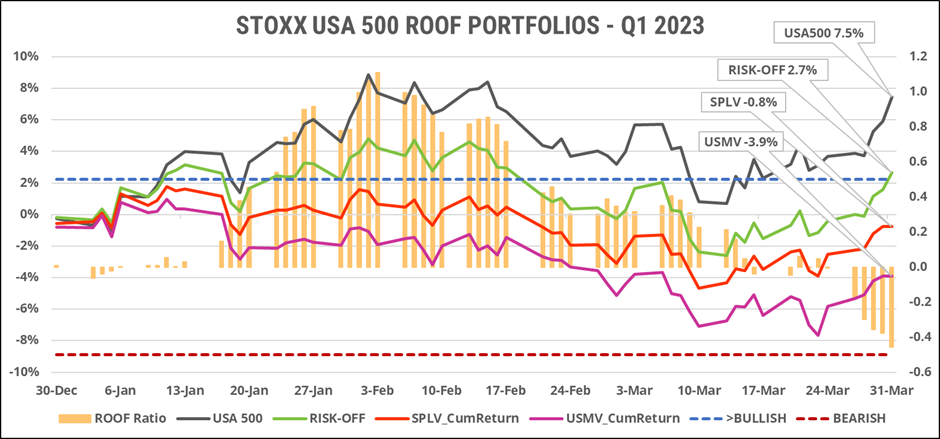
In the initial month of the year, as both sentiment and markets rose, the two ETFs were held back by their large negative active beta to the market. The Risk-Off portfolio, meanwhile, is constructed to achieve a defensive style factor profile but is constrained to maintain a neutral beta to the market. This methodology ensures that the ROOF portfolio is rewarded only for its risk-averse properties relative to the parent index, and not for making market timing bets (i.e., it swims in the same pond as a passive investor but sticks to the shallow end of the pond).
Conclusion
The ROOF portfolios performed as expected during the first quarter of 2023. Looking at both the average ROOF ratio for the quarter (0.36), and the fact that investors felt positive or bullish in almost two-thirds of the period, the outperformance of the Risk-On portfolio over the Risk-Off one is not surprising. We also notice that during the (very) short banking crisis, their relative performance was again aligned with their respective strategies: drawdown protection for the Risk-Off portfolio and drawdown exposure for the Risk-On portfolio. In times of crisis, the market does not reward risk-taking. It pays off to be risk averse.
We also saw that the implementation of a negative investment thesis using a simple definition of ‘fear’ limited to the single factor of Volatility (or avoidance of risk), comes at a cost when markets are not directionally constant. That is not to say that the Volatility factor or a minimization of the predicted variance of the portfolio is the wrong implementation for a risk-averse strategy. Both are part of the definition of being bearish. But focusing on a single factor dimension of ‘fear’ suffers from tunnel vision in ignoring the other dimensions. Our contention is that fear is multifactorial, so its portfolio implementation should involve multiple factors in addition to Volatility3. By broadening the definition of what it means — in terms of factor exposures — to be risk-averse, bearish investors can construct a more efficient portfolio that can better represent their investment thesis.
1 Note that a ROOF ratio below -0.5 is considered ‘bearish’ (depicted by the dashed red line in the charts).
2 Note that a ROOF ratio above 0.5 is considered ‘bullish’ (depicted by the dashed blue line in the charts).
3 See the ROOF Portfolio methodology documentation for details.


