

Apple. Amazon. Microsoft. Alphabet. It’s no secret that tech stocks are driving markets higher and have been important contributors to portfolio returns. But what about their impact on value-based strategies?
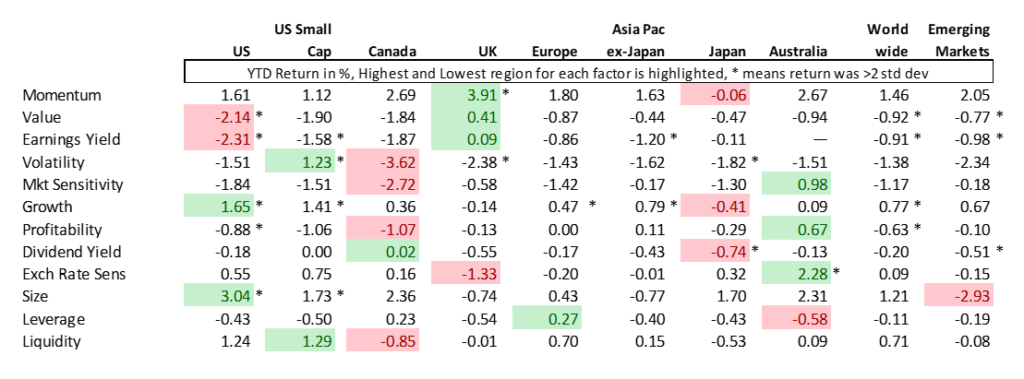
Not surprisingly, returns of both Value (defined as book/price) and Earnings Yield in the US model continued their run of underperformance into 2020—and it’s only getting worse. The table below highlights factor returns year-to-date through February 10. Both factors’ returns were not only lower in the US than in any other region, they were also more than two standard deviations below their long-term averages (in fact, they were both almost three standard deviations below). Shortfalls were similarly about three standard deviations for the factors in the Worldwide model, and about two in Emerging Markets. Only the UK saw positive returns to these factors.
And these returns are not just the result of one or two bad days. Of the 27 days in the period under study, the “normalized[1]” return for Earnings Yield was less than -1 on eight days, i.e., almost 30% of the time. In contrast, the long-term average (and expected) incidence of a one standard deviation return since 1999 is about 15%. Value looks even worse this year, breaching the minus one standard deviation barrier on 10 days, or 37% of the time. At the same time, each only had one day (February 5) in which the return was more than one standard deviation above average (we would expect around four).
To be sure, 2019 was not a great year for either factor, although both had positive returns in the fourth quarter. Value’s annual return was -1.36%, which fell within that two standard deviation range, and earnings yield was slightly up for the year. The perception of the annus horribilis was actually worse than the reality, at least according to our factor definitions.
Factor Performance, January 2-February 10, 2020
To determine how this underperformance was reflected in a real portfolio, we turn to the STOXX USA 900 Ax Value Index. As a reminder, this index uses an equal weighting of each factor as an alpha. For more information on the index and the others in the new STOXX Factor Index family, please see our recent paper “STOXX Factor Indices: Targeted Exposures with Managed Liquidity and Risk Profiles”.
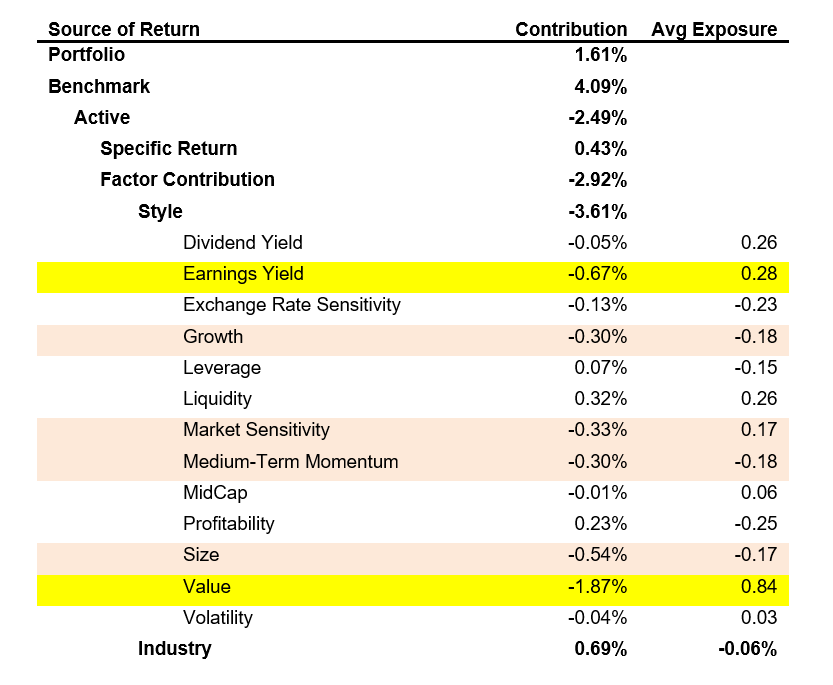
The Value index was up just 1.61% year-to-date, lagging the benchmark, the STOXX USA 900, return of 4.09% by almost 2.5%—an inauspicious start to the year, to say the least. More than half of that underperformance came from just the four stocks mentioned above. The portfolio held an underweight position in Microsoft and did not hold the other three. Note that the other big contributors to the lagging performance were overweights in Ford, Phillips 66 and General Motors, so it was not all driven by these big Tech names.
The portfolio is constructed with small active weights in sectors and style factors other than Value and Earnings Yield. When we look at factor-based attribution, we see that industry/sector weightings were not a big contributor to the underperformance, but even the small positions in other style factors—especially Growth (negative exposure), Market Sensitivity (positive exposure), Medium-Term Momentum (negative), and Size (small-cap bias)—all meant significant hits on performance, owing to the fairly large magnitude of the returns of these factors.
Factor Attribution, January 2-February 10, 2020
While Value and Earnings Yield returns were not all that bad in 2019, the STOXX Value index lagged significantly (up 22.17%, versus the STOXX USA 900 return of 31.75%), also hurt by underweights in Apple, Microsoft, Amazon and Alphabet, plus Facebook and JP Morgan, among others.
We have written recently about our belief that Value strategies are not dead (see here, for example). While this cyclical downturn in the factors’ returns may be unusually severe, it seems to be the result of other market conditions that are continuing to propel a few stocks (with poor Value characteristics) substantially higher, rather than an inherent problem with Value itself. Whether the unusually poor performance reverses soon, of course, remains to be seen.
[1] (Return – long-term average return)/daily predicted volatility from the prior day.


