

The spectacular “recovery” of US blue-chip stock indices is frequently cited as an indication that investors are betting on a swift, “V-shaped” global recovery from the coronavirus crisis. Yet, almost all other markets seem to be telling a very different story. Many European benchmark indices have yet to recoup their losses since the start of the year. The EURO STOXX® 50 is down by 10% and its UK equivalent by more than twice that much. Even Germany and The Netherlands—two of the best-performing countries in the Eurozone—have barely broken even. Sovereign yields, meanwhile, imply a prolonged period of ultra-low interest rates, while credit spreads continue to lag behind share prices.
The STOXX® USA 400—the mid-cap portion of the wider STOXX® USA 900—is also only marginally in positive territory, compared with a year-to-date gain of more than 13% and record highs on almost a daily basis for its bigger brother, the STOXX® USA 500. The year-to-date cumulative returns of both are shown in the chart below. As my colleague Diana Baechle noted in her blog post on how The US market can thank its FAANGs, the STOXX®USA 900 would have still been in negative territory by the end of July, had it not been for the phenomenal returns of the likes of Amazon, Microsoft, Apple, Nvidia, PayPal, Netflix, Facebook, and Shopify, to name just the biggest contributors. As we noted in another recent blog post, all of these companies profited from the effects of global lockdown measures.
US equity large cap, mid-cap, and credit-spread year-to-date returns
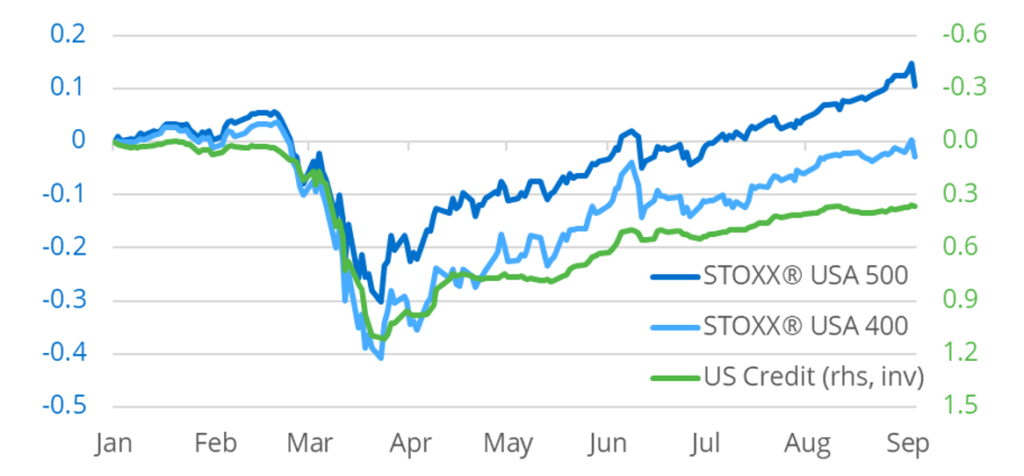
The chart above also shows the credit-spread return for issuers from the United States, estimated using the new Axioma Factor-based Fixed Income Model. While corporate-bond risk premia have rebounded significantly since the spread peak in late March (note that the green line is plotted against an inverted scale on the right), they still have some catching-up to do relative to the stock market.
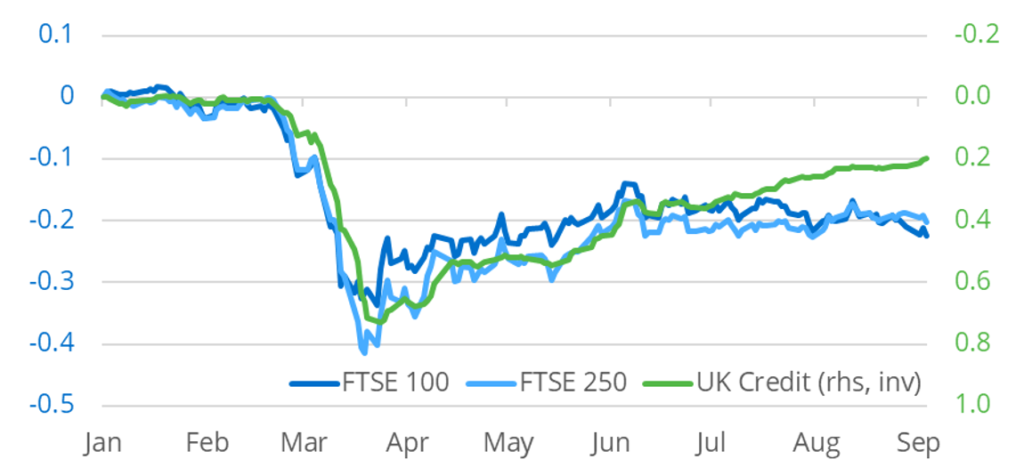
The chart below provides the same analysis for the United Kingdom, where the relative performances—both large-cap versus mid-cap equities, as well as against credit-spread returns—have been much more consistent. Far fewer companies in the UK profited from the coronavirus crisis, apart from online grocery retailer Ocado and a number of mining and trading firms, which benefitted from flight-to-safety flows into precious metals. But these could not make up for the huge losses incurred by the large banks, which dominate the British equity benchmarks and which, beside aerospace & defence and oil & gas, have been the worst-performing sector in the EURO STOXX® universe so far this year. The recent strengthening of the pound—thanks mostly to a weakening dollar, with some ongoing Brexit uncertainty on top—would also have weighed on the large, internationally active corporations in the FTSE 100.
UK equity large cap, mid-cap, and credit-spread year-to-date returns
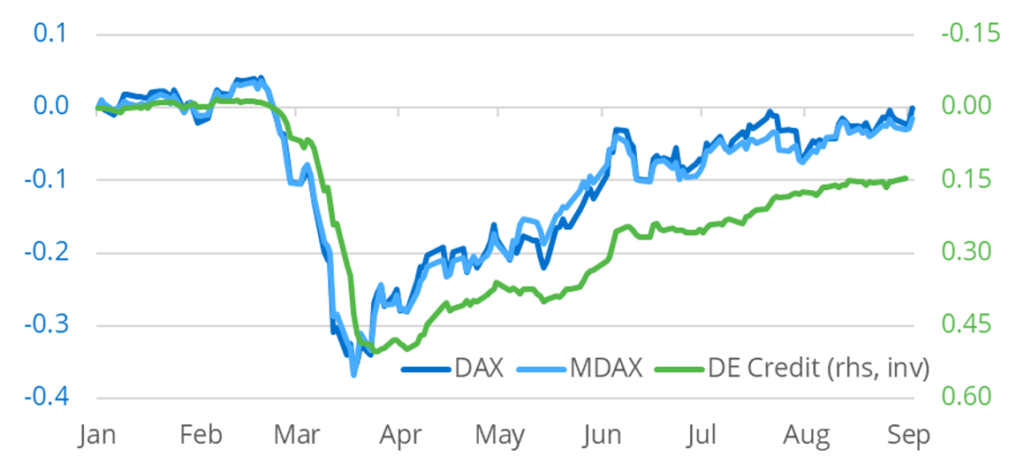
The significant share-price drops of financial and energy companies were also responsible for the significant loss of nearly 30% in the Austrian equity benchmark, as these two industries account for more than half of that country’s stock market. At the other end of the spectrum sits Denmark, which, thanks to its large exposure to the healthcare sector (>50%), is the best-performing country in Europe, with a year-to-date return of more than 15%. The Netherlands and Germany (pictured below) are just about breaking even, while the EURO STOXX® is still down by more than 10%. A more detailed analysis of country-by-country analysis can be found here.
German equity large cap, mid-cap, and credit-spread year-to-date returns
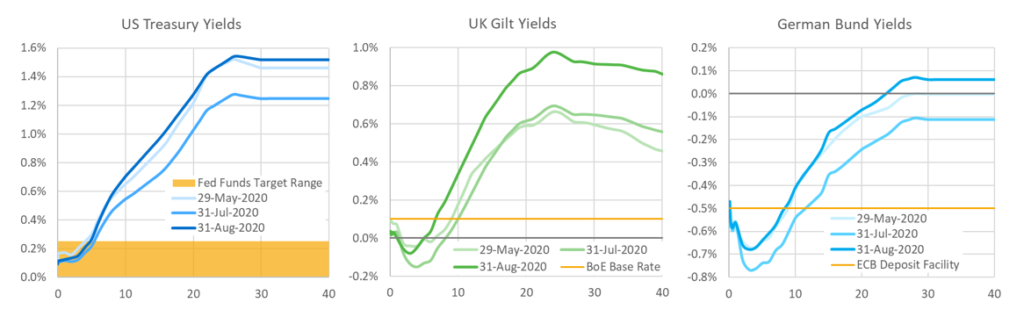
Sovereign bond markets, meanwhile, appear to be preparing for a prolonged period of ultra-low central-bank rates. US Treasury yields of up to 5 years are now within the Federal Funds target range of 0-0.25%, while lending one’s money to the German government for less than 10 years provides an even more negative return than depositing one’s spare cash with the European Central Bank at -0.5%. In fact, one would have to commit one’s funds for almost 30 years to simply get one’s money back after that time. Even in the UK, where the Bank of England had long suppressed the notion of negative interest rates, Gilt yields of up to 5 years are now firmly below zero.
Sovereign yield curves and central bank rates
The US stock market at the moment reminds me of the motorist in an old German joke, who drives in the wrong direction on the Autobahn. When he hears the warning message on the radio, he exclaims: “What? One? There’s hundreds of them!” So, maybe, the European equity indices and the bond markets are better indicators of what investors are really betting on. And let’s not forget that the latter have a much better track record when it comes to predicting what’s next for the world economy.


