

“Risk” is a word everybody uses, but almost no one can describe with clarity. In finance, it is often referred to as the inessential – even disreputable – member of a two-term set: risk and return. This set of terms is elastic but in all its many references, risk is the subordinate term, and in the traditional investment jargon, there is even a nagging suggestion that we would all be better off without it.
Considering risk as orthogonal to return, makes it seems optional and incidental, even when it unmistakably reasserts itself as it did this past February. It is almost as if return comes prior to risk, even despite it. Risk and return are by no means mutually exclusive, they are part of the same experience. So, overlook it at our own peril. Risk is always there, ignoring what everyone knows – or thinks they know – with infuriating insouciance. It asks no quarter and gives no quarter[1]. Its purpose is presentation of the facts; its motive, disinterested truth.
And therein lies the rub. Can there ever be multiple versions of the truth? Can risk be at the same time rising and falling? High and low? And if so, which should we chose to believe?
For over a decade, Axioma has disrupted the risk analytics world by championing the use of multiple models in risk management with its fundamental and statistical variants. This is not a contradiction. Clarity comes from a deeper understanding of both the nature and size of the sources of risk in your portfolio. Any discrepancy in the risk breakdown between the two methodologies (statistical versus fundamental) or horizons (short-term versus medium-term) variants reveals unique insights that can often be used as a leading indicator of where risk is headed.
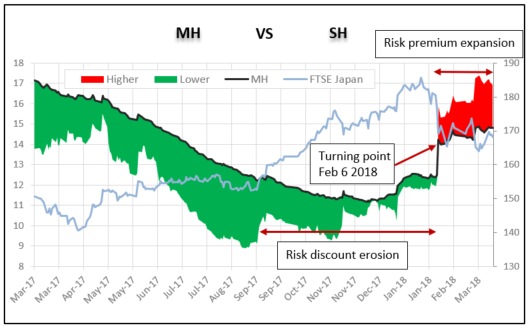
The chart below plots the predicted risk of the FTSE Japan All Caps index using both the medium-horizon (MH = 3 to 6 months) and short-horizon (SH = 1 to 3 months) variants of our Japanese fundamental model (AXJP4)[2]. The black line is the risk forecast of the medium-horizon model for the index. The shaded areas represent the risk discount (green) or risk premium (red) from the short-horizon model. When the shaded area is green, the short-horizon model predicts a lower risk than the medium-horizon one, indicating that risk is trending down. A red shaded area indicates times when the short-horizon model predicts a higher risk than the medium-horizon one, indicating that risk is trending up.
In this trailing twelve months ‘Risk-Gap’ chart, we see that in Japan the risk discount from the SH model started to erode as early as September 2017, indicating that risk was trending up in the short-term. This discount completely disappeared by early January 2018, moving to a risk premium almost immediately. It has been expanding ever since, indicating that in the short-term, risk may continue to rise. The risk forecast from the medium horizon model had actually started inching up at the start of January but at a slower pace than its short-horizon counterpart.
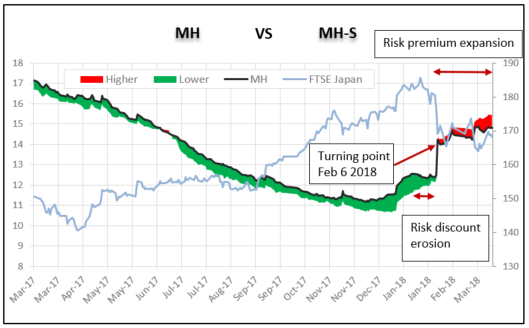
Comparing the medium horizon of two methodology variants (i.e. MH Fundamental (MH) versus MH Statistical (MH-S)) gives us the same early warning, although the risk-discount erosion period was much shorter in this case. Many observers have pointed to the very fundamental drivers of risk this time around (interest rates) as a possible reason why statistical models reacted later than fundamental ones, since the former does not have industry or fundamental style factors such as Utilities, Banks, Dividend Yield, FX Sensitivity, etc. which were directly impacted by rising bond yields.
Investors can use the risk-gap between models on the overall predicted total or active risk of their portfolios as an early warning signal on changing risk regimes. Once risk is identified as rising or falling, drill-down further by looking at discrepancies at the individual factor and holdings level[1]. There may only be one ‘true’ risk (which we can’t measure), but a second opinion can help you validate the ‘truth’ of the first estimate and keep you ahead of the game.
[1] See this post be Melissa Brown on the February volatility spike in historical context!
[2] Similar charts for other markets are available upon requests: odassier@axioma.com
[3]See research paper “More than just a Second Opinion” for details on how to compare risk model variants at the individual holdings level and what insights on stock selection it can provide.


