

We can all agree that understanding risk – specifically, the reason why a risk number has changed – is key for sound portfolio management. This understanding becomes even more important in times of volatility when correlations that once moved in one direction can swing the other way, reducing – or even removing altogether – the diversification that was intended to protect a portfolio. But this change in risk could be down to a number of reasons, making this task quite a challenging one: Did the trading activity generate exposure to new factors or the existing ones? Were there changes in risk factor volatilities or the correlations among risk factors?
Pinpointing the impact
Being able to assess if a portfolio manager may have made changes in exposures that either increased or decreased risk is a conundrum that is probably impossible to answer for simulation-based analytics. However, we believe that by using a parametric method, which is a valid approach for small or negligible convexity – of which most portfolios are – the question can be answered relatively simply.
Breaking it down
The parametric approach and the closed formula used to derive portfolio volatility can easily give us the sensitivity of the risk function to the change in the parameters being used: exposures, factor volatilities and correlations. If we can decompose a change in risk into these three main effects, we can easily see if exposures to risk factors have been managed to reduce risk, which factor volatilities are driving the volatility effect and which correlations have taken away the diversification effect.
Change in risk explained by effect type

The exposure effect captures the impact of changes in exposures between two dates. Such changes can be due to two sources: trading resulting in exposures changes and exposures changing naturally (equity loadings changing, sensitivities such equity delta or durations changing through time, etc.). We would expect the biggest component coming from the former.
The volatility effect captures changes in factors volatilities which can, as one would expect, be crucial in times of crisis when volatility shoots up, in particular for equity and credit spreads. While volatilities can change significantly, those changes are in general, gentle compared to exposure changes.
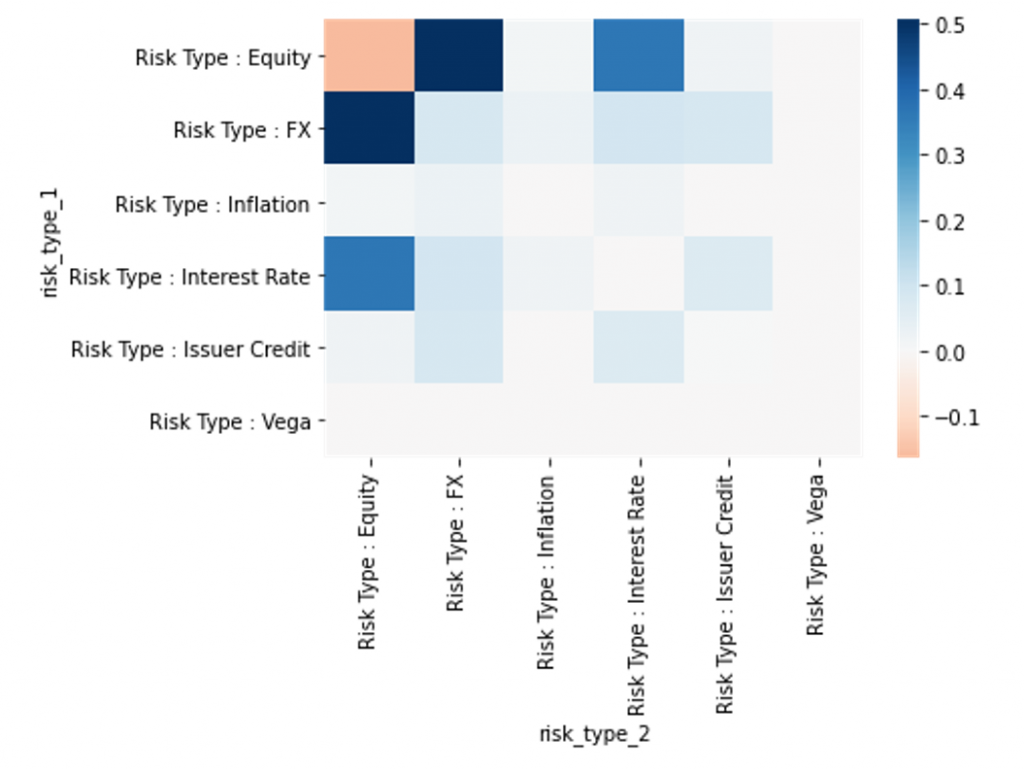
The correlation effect might not be in most cases the predominant effect compared to the other two. It is however crucial to monitor as any significant contribution will give an indication of how factor correlation moves impact the portfolio risk. In normal circumstances, low or reasonable correlation between factors will naturally yield a diversification effect and protect the portfolio as a result. The correlation effect will be captured in a heatmap.
Breakdown of correlation effect by risk type
Why use this approach?
The methodology we propose is simple: Decompose the risk function variation through a Taylor expansion of the parametric risk function. When the residual part is small and negligible, the method is incredibly attractive as the effects computed are additive and allows for insightful analysis. The big advantage is that changes can be explained linearly by effect down to the factor as well as through time.
In our longer whitepaper, ‘Using a Parametric Approach to Understand Changes in Risk’, we describe in more detail the methodology being used and the types of outputs and analysis that can be generated using Axioma RiskTM. To learn more, download the paper here.


