Recent market movements bring back memories of a similar series of events almost exactly three years ago: a sudden drop in share prices, a sharp rise in Treasury yields and a strengthening dollar—all of it blamed on inflation. And although the losses at the time amounted to less than 10%, it took the US stock market more than six months to recoup them. The sudden co-movement of equities, bonds and FX rates also drove a spike in multi-asset class portfolio risk.
On Friday, February 2, 2018, the STOXX® USA 900 index fell by 2%, following a seemingly upbeat labor-market report, which showed that the US non-farm sector had added 200,000 new jobs in previous month—beating analyst expectations of 180,000. So why did share prices drop? Digging deeper into the details of the report eventually revealed the likely culprit: average hourly earnings were up 0.3%, purportedly evoking fears of rising inflation.
In fact, breakeven inflation (BEI)—derived from price differences in inflation-protected versus nominal US Treasuries—had been steadily climbing alongside share prices and sovereign yields for many months, surpassing the Federal Reserve’s 2% target only two weeks earlier. The chart below shows the 10-year US BEI rate, together with same-maturity Treasury yield and the STOXX® USA 900 index, from September 2017 to August 2018
US breakeven inflation, sovereign yields, and stock market 2017/18

The similarities to the recent environment are striking: for months prior to the sell-off, analysts, market commentators and central bank officials alike had been bending over backwards to assure investors that increasing consumer prices were a sign of a healthy, growing economy. Rising share prices had been accompanied by a steady ascent in both breakeven rates and sovereign yields. Yet, once (expected) inflation had risen above 2%, the stock-market rally stalled, and share prices retreated by almost 10%, while Treasury yields surged 20 basis points. It then took equity benchmarks another six months to rise above the previous peak, while the 10-year yield added another 25 basis points in the following 14 weeks.
The initial share-price drop of 2.6% on February 25 this year (indicated by the dashed orange line in the chart below) was also accompanied by a 12-basis point surge in the 10-year benchmark yield. The upward shift was even more pronounced in the “belly” of the curve (4 to 7-year maturities), where yields rose by up to 20 basis points, following the lukewarm reception of $62bn worth of new supply in 7-year notes.
US breakeven inflation, sovereign yields, and stock market 2020/21

The lackluster demand at the latest Treasury auction—apparently the lowest bid-to-cover ratio in at least 12 years—indicates that there may have been deeper concerns at play. After all, the anticipated $1.9tn fiscal rescue package has so far only passed the first hurdle in the U.S. Congress; so there is a lot more debt to be issued in the coming months. And it is questionable how much of it the central bank is actually going to underwrite—especially once realized inflation actually surpasses the 2% Fed target[1].
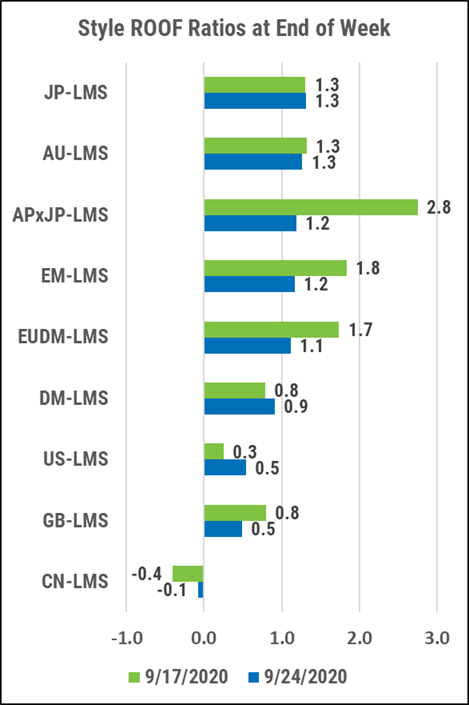
To make things worse, most developed stock markets have shown a potential reversal in sentiment from bullish to bearish, as my colleague Olivier d’Assier noted in his most recent ROOF™ Score Highlights. And although share prices seemed to be relatively quick to rebound, a prolonged period of above-target inflation expectations, accompanied by a further increase in bond yields, could impede further upside potential in the stock market for a while, as it did in 2018.
Back in February 2018, the sudden co-movement of share prices, bond prices and exchange rates led to a doubling of predicted short-term risk for Qontigo’s global multi-asset class model portfolio from 7% to 14%. So far, we have observed nothing of the same magnitude, but interactions between the major asset classes are already showing the first signs of turning positive once more, especially with the stock/bond price correlation going from -0.51 to almost zero in just one week, as shown in the two correlation matrices below[2].
Major risk type correlations

The relationship between breakeven inflation and equities, on the other hand, went from +0.51 to 0.06, indicating that additional acceleration in consumer-price growth is no longer expected to result in a further rise in share prices. On the flipside, the inverse interaction between implied inflation and sovereign bond prices intensified, meaning that higher yields—and consequently lower prices—are still in the cards.
For more details on recent changes in market and portfolio risk, view the latest Qontigo Multi-Asset Class Risk Monitor update here.
[1] It is worth noting that current US consumer-price inflation stands at around 1.4%. The breakeven rates used in the analysis, on the other hand, were derived from comparing inflation-protected with nominal government bonds. Like FX forward rates or option implied volatilities, they are a mathematical construct and not necessarily a predictor of what is likely to come.
[2] The correlations were generated from daily risk factor returns over the three months preceding the displayed valuation date, using the Axioma Risk™ portfolio analysis platform. They represent the parts of security returns that were driven by the respective factors, not the factor timeseries themselves. So, for example, a negative correlation between equities and “interest rates” implies an inverse movement of stock and sovereign-bond prices.