

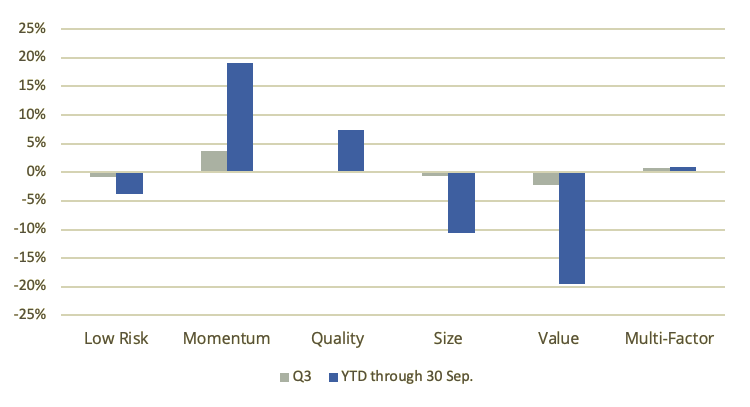
The third quarter (Q3) saw a continuation of 2020’s themes for the STOXX® Factor Indices, with Momentum leading the way with strong outperformance, Quality maintaining its robust year-to-date (YTD) performance, and Value, Size and Low Risk remaining challenged. Signs of renewed life have appeared, however, with Multi-Factor seeing a 0.8% return in Q3, bringing its performance to firmly positive territory for the year. In Figure 1, we show Q3 and YTD returns for the STOXX Factor Indices in excess of their benchmark – a remarkable year so far for active returns, in both the ‘right’ and ‘wrong’ directions.
Figure 1 – STOXX Global 1800 factors 2020 active returns
Methodology Spotlight: To constrain or not to constrain
While performance is a key, easily observable metric in assessing strategies, how that performance is achieved is critical for investors to understand. As is the continuing theme in our first year of quarterly spotlights, we will revisit selected methodology parameters of the STOXX Factor Indices, and assess how these have (or have not) contributed to the overall objectives in the index.
Constraints within an optimization process allow for more control over outcomes of the index. However, they also result in trade-offs that the portfolio must bear. If, for example, we seek to maximize our exposure to Quality, then, logically, adding any limitations on which securities we can hold impairs our ability to achieve this maximum exposure. This does not necessarily mean that this potential sacrifice is not worth making. Particularly in the context of seeking to reduce unintended exposures — a key objective of the STOXX Factor Indices — the usage of constraints allows for the efficient management of these trade-offs. Here, we will examine the compromises and pay-offs of sector and tracking error (TE) constraints.
Industry caps
The STOXX Factor Indices embed a 5% active weight constraint on ICB Industries (Level 1), meaning the industry weights of the index at each rebalance is limited to +/- 5 percentage points vs. the benchmark. This feature seeks to limit certain biases that can arise in maximizing exposures to certain factors — for example, a Low-Risk factor strategy loading up on exposure to the utilities sector. It should be noted that sector tilts can naturally arise from price movements in between rebalance dates, so the sector constraint is only enforceable at rebalances. Nevertheless, the trade-offs between full and partial sector neutrality can be clearly illustrated. To do this, we compare test versions of the STOXX® Global 1800 Ax Multi-Factor Index that impose either no or full sector constraints at each rebalance date.
Figure 2 – Annualized contributions, STOXX Global 1800 Ax Multi-Factor Index test portfolios
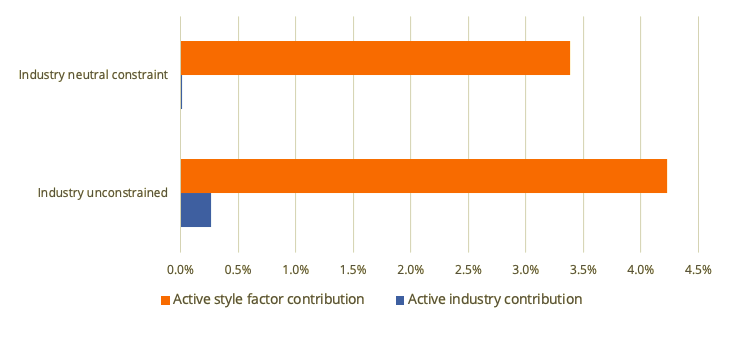
As can be observed in Figure 2, when moving from no sector constraint to full sector neutrality, industry contributions decline over the period measured; but on the other hand, so do style factor contributions. Note that we are using the full length of data available, while recognizing that the results can differ over shorter time frames. Using this long-term data, however, implies a trade-off between two logical objectives for factor index construction: the strength of the targeted factor exposure versus the ‘purity’ of the return sources.
Tracking error constraints
Within the long-only space, TE is a key objective of many investors. TE allows for the measure of the riskiness of active returns, which, in turn, lets investors measure how much (or little) they are being compensated for their deviation from the benchmark. One of the unique features of the STOXX Factor Indices is their usage of a risk model that allows for the calculation of an ex-ante, or forecasted, TE. This can become a useful feature for ensuring a TE budget is used efficiently. In this section, we will attempt to assess what the TE constraint means in terms of trade-offs. To do this, we show the active performance and risk of several versions of the STOXX Global 1800 Ax Multi-Factor Index with differing TE constraints: 1%, 3%, 5% (as with the index), and none. As with the sector constraint, it is important to note that this constraint is enforced at rebalance dates (using ex-ante figures), and ex-post TE can of course fluctuate. Results for both the full backtest and YTD are shown in Figure 3.
Figure 3 – Alpha vs. TE, STOXX Global 1800 Ax Multi-Factor Index test portfolios
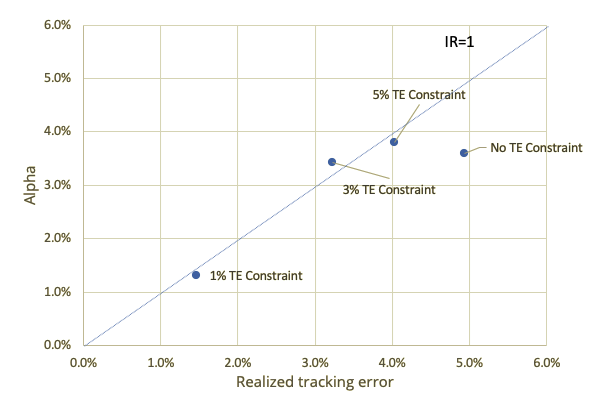
Over the full backtest period, and again recognizing that shorter time frames can yield different results, we generally observe an increase of both alpha and TE with the loosening of the TE constraint from 1 to 5%. The realized TE of the Multi-Factor strategy is roughly 4%, and the 5% TE constraint has typically only become binding in stress scenarios, e.g. the global financial crisis and dot-com bust. The trade-off of both lower return and risk with tighter TE constraints is a straightforward one, but interestingly, the allowance of additional TE in the unconstrained portfolio generated more risk, but not more return. Looking more closely into the source of this increased risk, we observe that the Market Sensitivity factor (which measures the beta of stocks) was the biggest contributor of the difference.
Conclusion
As we enter the final quarter of an extraordinary year, staying the course remains the mantra for equity factor investors. Much industry research continues to be undertaken: is Value broken? is Size a factor? what is happening with Low Risk? has mega-cap performance permanently altered the landscape? and much more. It is a good thing to challenge assumptions. But while the definitions and choice of factors remains a key driver of outcomes, it is difficult to forecast how a factor will perform. It is less difficult, however, to ensure that portfolio construction matches the objectives one is seeking to achieve. For the STOXX Factor Indices, we will continue monitoring the health of the strategies through analytics, and verifying that one of the driving beliefs behind their creation — that portfolio construction matters — remains true.


