

Author note: This post would not have been possible without the significant contributions of my colleagues Adrian Zymolka, Rodolphe Bocquet and Anna Georgieva.
ESG integration, sustainability, and impact investing…
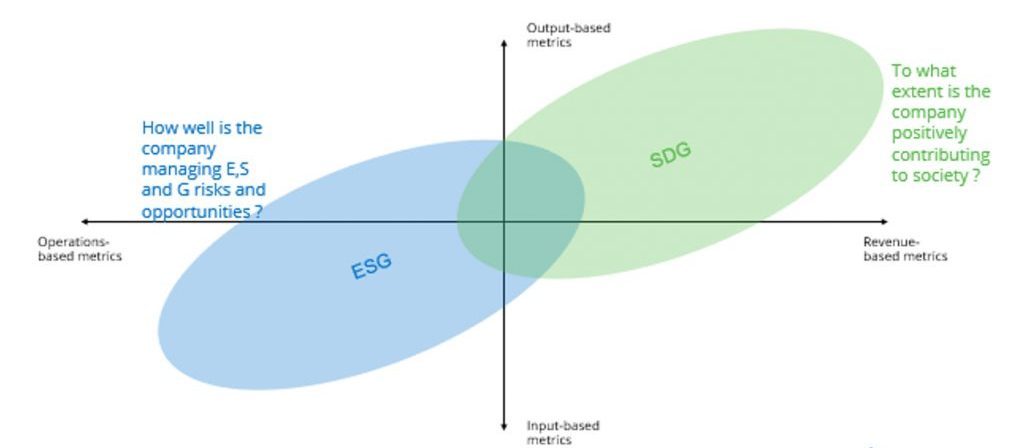
While there may be overlap in the meanings of these terms, they each represent a distinct approach to “doing well while doing good” in investor portfolios. A simple view of the differences between using ESG and the SDGs as an analytical framework in sustainable finance can be seen in the diagram below. In this post, we hope to shed a ray of light on the overlapping portion.
How SDG differs from ESG?
One approach to understanding how a company contributes to real-world societal outcomes (the SDG segment) comes from the Sustainable Development Investments Asset Owner Platform. Backed by some of the largest asset owners in the world, SDI AOP helps investors to embed the UN Sustainable Development Goals (SDGs) into their investment processes, through standardized data derived from both artificial and human intelligence.

An example of an ESG approach can be found in the STOXX ESG-X family of indices, which exclude companies that do not adhere to certain norms and are involved in production activities deemed not compatible with ESG values[1]. Note that excluded companies can be seen as the “negative” of SDI companies. (SDI scores only identify positive contributions to SDG).
In this post we demonstrate a use case for the SDI AOP data, while also illustrating instances in which the ESG and SDI concepts overlap. We look at a year-to-year comparison of data, as company classifications for 2021 have recently been released. While this is a tall order for a short post, it is meant only as an introduction to the use of SDI AOP data. And while we have focused this study on the STOXX Global 1800 ESG-X Ax Value index (the “portfolio”), when comparing it with a non-ESG counterpart (the “benchmark”), we would expect to see similar conclusions using other ESG-X factor portfolios or, indeed, other ESG-aware portfolios.
The SDI AOP Universe Covers a Large Portion of Global Developed Market Names
The first step in our analysis is to ensure a sufficient proportion of each index is covered by the SDG analysis. Covered companies are categorized as follows: “Majority” if more than 50% of revenues are derived from one or more of the SDGs; “Decisive” for 10% to 50%; and “Non-SDI” for those companies with less than 10%.
To reiterate, our example compares the STOXX Global 1800 ESG-X Ax Value index to its non-ESG-screened counterpart (“Benchmark”). Using the index components as of January 6, 2021, we observe that about 83% of the names and 87.6% of the weight of the portfolio was rated in 2020, a slightly lower proportion of the weight, although a few more names, as compared with the benchmark. A higher proportion of both names and weight are covered by the 2021 classifications, and the levels for both the portfolio and benchmark are similar. We believe this was a sufficient level of coverage to continue our analysis.
Percent of Names and Weight Covered by SDI Ratings
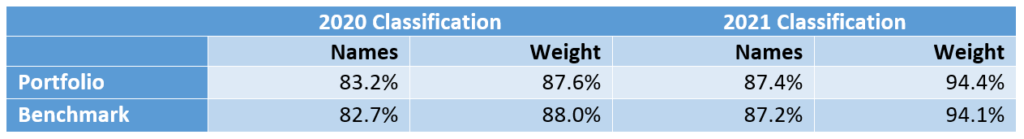
Portfolio: STOXX Global 1800 ESG-X Ax Value
Benchmark: STOXX Global 1800 Ax Value
Source: Entis, Qontigo
The Intersection of SDI and ESG
Now we turn to the classifications for STOXX Global 1800 Ax Value and calculate the proportion of the classified weight that falls into each category. For the 2020 classifications, 11.4% of the 87.6% rated names in the portfolio, or roughly 10% of the index, were Majority SDG, and another 2.9% were ranked “Decisive”, with 73.3% determined to be “Non-SDI” (of course, the remainder is not rated). The benchmark in this case had fewer majority and decisive companies, and therefore a higher proportion of non-SDI names. The table also shows that the “improvement” for the portfolio versus the benchmark was large for Majority and Decisive companies. In other words, the ESG-X Value portfolio contained more names that meet the criteria to qualify as an SDG contributor, as compared with the non-ESG index. The relatively small proportions of names in the SDI categories drive home the point that SDI and ESG (at least ESG exclusion indices) are not interchangeable, but the improvement of the ESG-X portfolio over its counterpart also suggests there may be some overlap, at least for a global Value portfolio. By overlap, we mean that revenue contribution toward meeting sustainable development goals may also correlate with a better ESG profile. Since the ESG-X indices are designed to exclude the worst offenders, not necessarily to load up on the best ESG companies, we would expect there to be correlation, but a relatively small one.
The breakdown for 2021 shows an improvement over 2020 from an SDI perspective. Almost 12% of the 94% weight (i.e., more than 11% of the total portfolio) fell into the Majority category, and almost 6% was considered Decisive. And as we calculated using the 2020 rankings, more of the weight of the ESG-X portfolio was Majority or Decisive, as compared with the straight Value portfolio. Also note that the portfolio and benchmark used were the same, the only difference was the SDI ratings. The improvement in SDI profile, then, would have come from more companies meeting the positive SDI criteria in 2021 (a likely goal of the whole initiative is to encourage companies to strive to contribute towards the achievement of the SDGs by 2030), along with newly covered industries.
Percent of Covered Weight in Each SDI Category
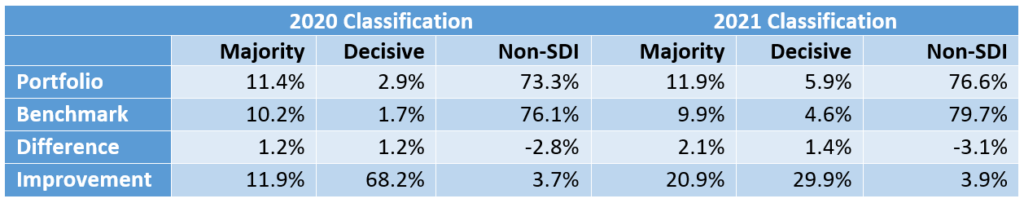
Portfolio: STOXX Global 1800 ESG-X Ax Value
Benchmark: STOXX Global 1800 Ax Value
Source: Entis, Qontigo
Conclusion and Next Steps
This simple analysis tells us, first, that ESG exclusion portfolios and Sustainable Development Goals are not necessarily mutually exclusive, although they are also not perfectly correlated. Further research using portfolios with more ESG concentration will likely show a higher overlap than we showed here, and there is certainly room for both ESG and SDI in an investment portfolio. And second, although a large proportion of stocks in the Global Developed universe are covered, a relatively small but growing proportion meets the minimum criteria to be defined as satisfying SDI criteria.
This analysis can be run for any portfolio and benchmark and is intended to help asset owners and managers understand how their portfolios are positioned in meeting SDI goals. Further analysis can reveal the exposure to individual goals, how sector and country bets impact exposure, how much trading would be required to attain a specific SDG exposure, and more. Email sdi@qontigo.com for more information.
[1] Based on a selection of STOXX Benchmark indices the ESG-X index methodology applies standardized ESG exclusion screens based on global norms, controversial weapons, coal and tobacco. For more detail on these indices, please see here.


