

US and Asian stocks slid in February, as better-than-expected economic reports in the US signaled the Federal Reserve has room to continue raising interest rates. European shares climbed when measured in euros.
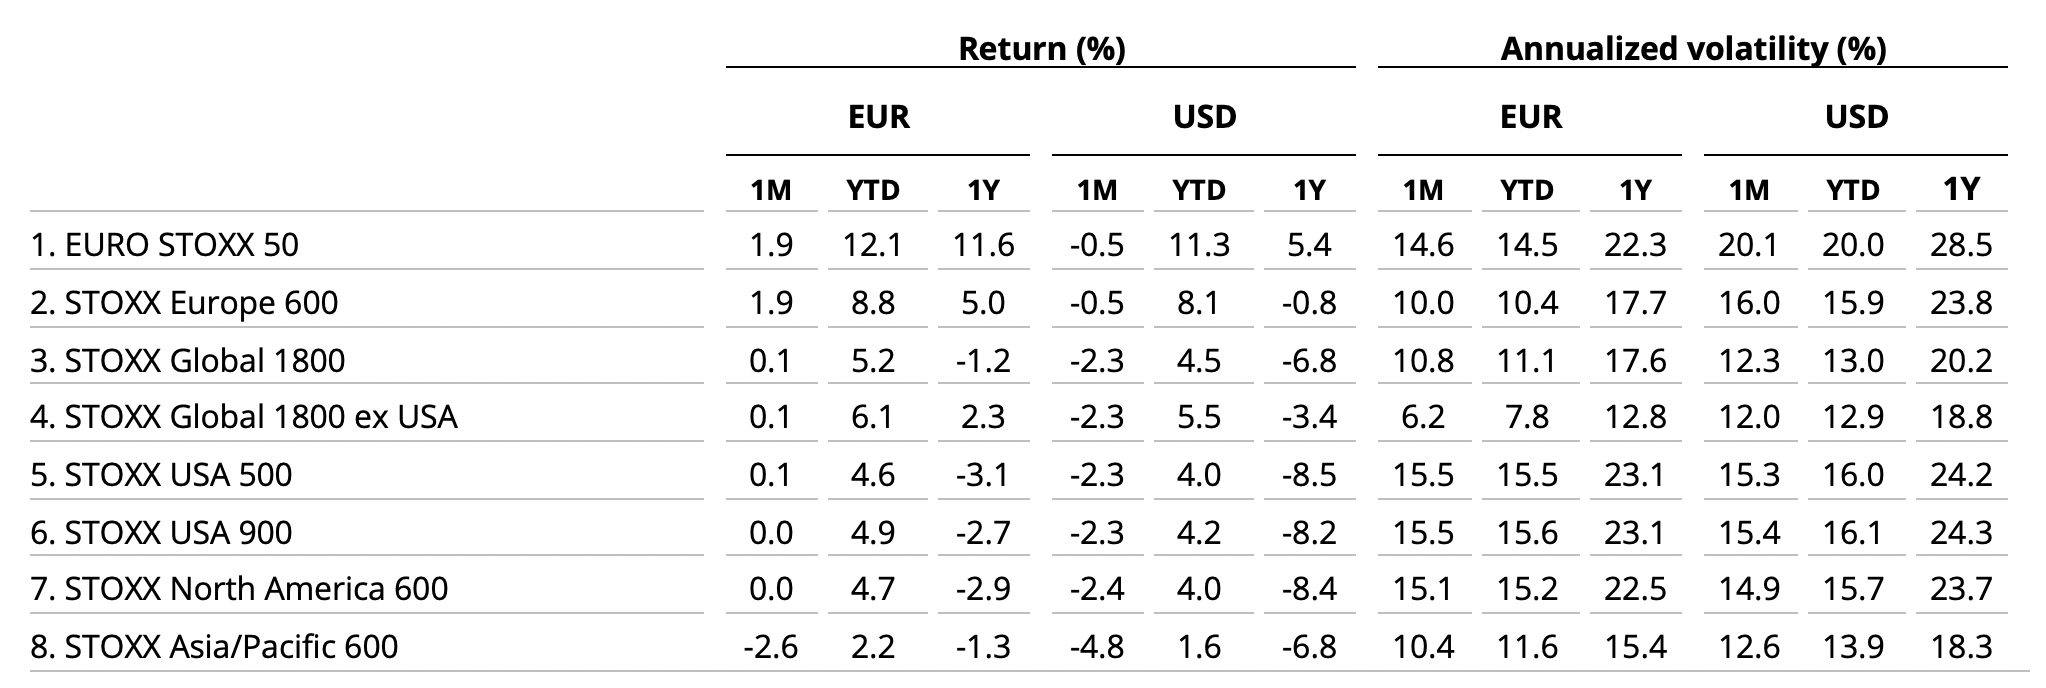
The STOXX® Global 1800 index fell 2.3% last month when measured in dollars and including dividends1. The global benchmark slid 17.9% in 2022, its worst year since 2008, as central banks pressed ahead with interest rate hikes to fight runaway inflation. The index added 0.1% in euros in February after the greenback rose 2.4% against the common currency.
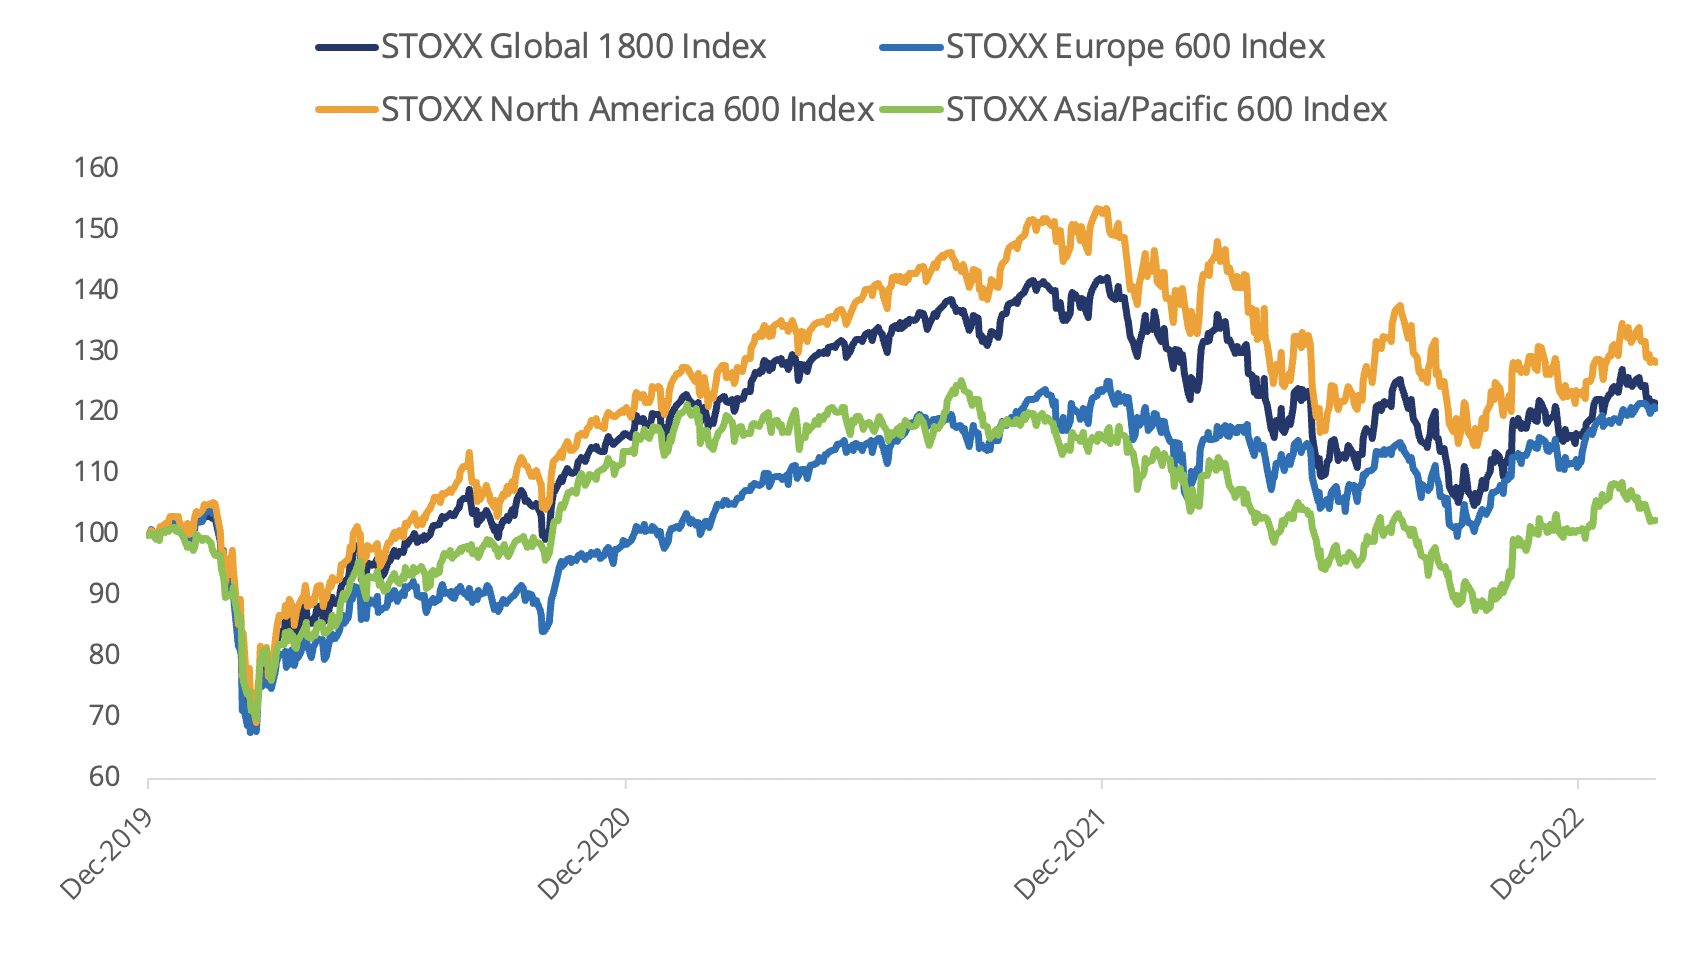
The Eurozone’s EURO STOXX 50® gained 1.9% in euros in the month, as did the pan-European STOXX® Europe 600.2 The STOXX® North America 600 dropped 2.4% in dollars, while the STOXX® USA 500 lost 2.3%. The STOXX® Asia/Pacific 600 fell 4.8% in dollars.
Figure 1 – Benchmark indices’ February risk and return characteristics
Germany’s DAX® rose 1.6% in the month. MDAX®, which gauges the performance of German mid-caps, dropped 0.6%.
| For a complete review of all indices’ performance last month, visit our February index newsletter. |
American resilience
The US added 517,000 payrolls in January, a report showed last month, nearly double December’s total and almost triple economists’ forecast of 185,000.3 A government release on Feb. 24 showed inflation ticked higher in January after falling in previous months, as Americans spent more. A string of better-than-expected economic reports are bolstering expectations that the Fed will need to tighten monetary policy further. The 10-year US Treasury yield ended February at 3.9%, up from 3.4% at the start of the month, reflecting market participants’ estimates for higher borrowing costs.
Figure 2 – Annual % returns for STOXX Global 1800 index
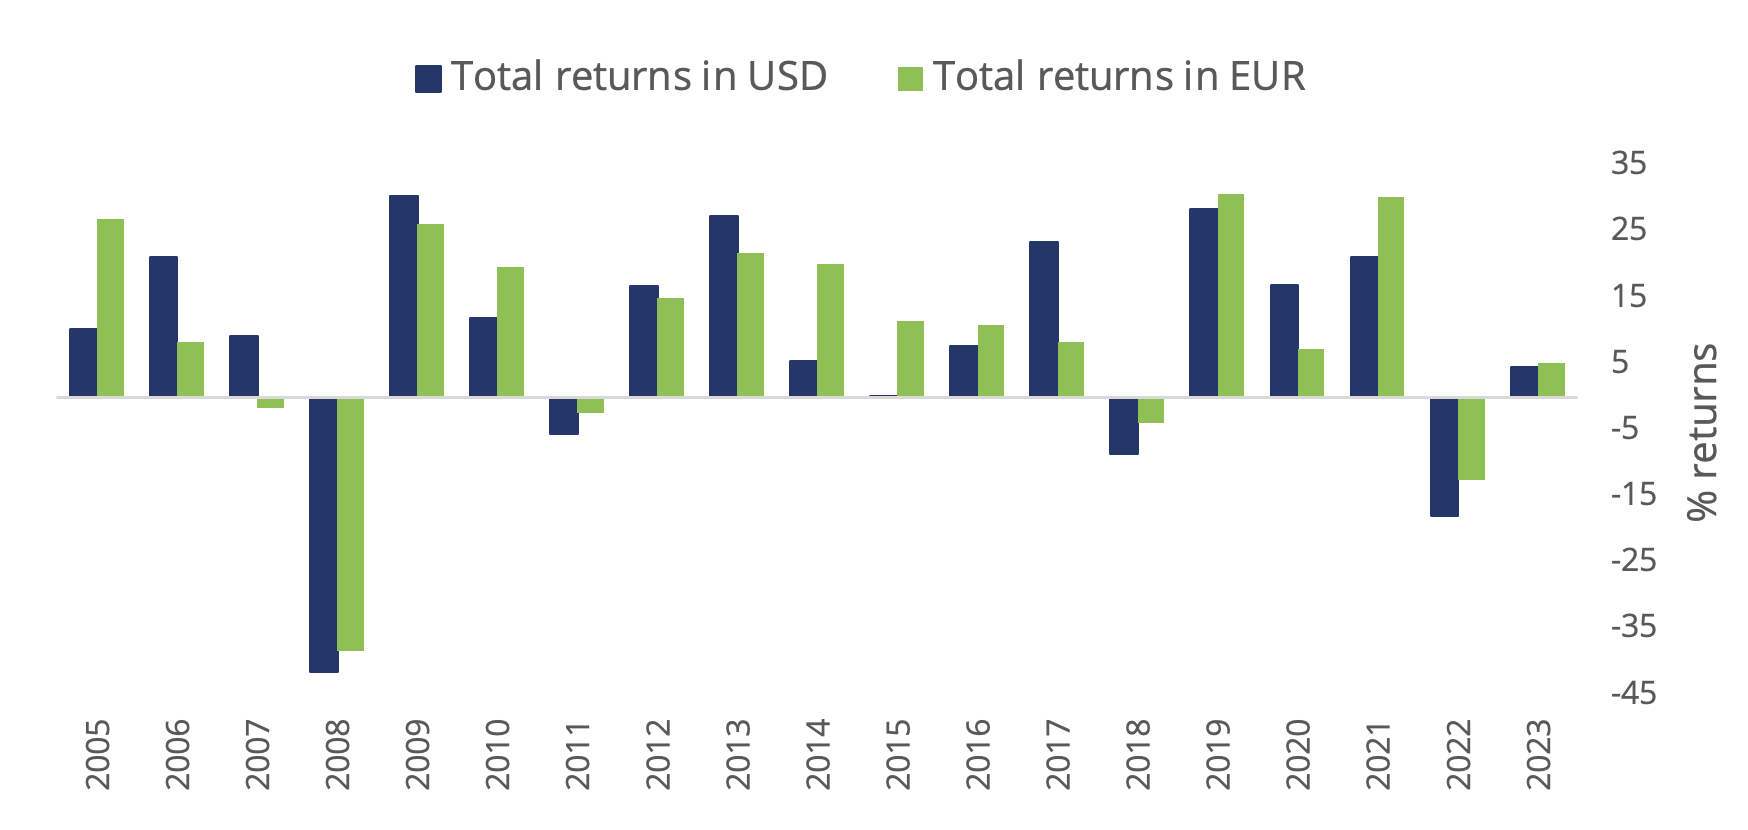
Figure 3 – Returns since Jan. 1, 2020
Volatility rises
The EURO STOXX 50® Volatility (VSTOXX®), which tracks EURO STOXX 50 options prices, climbed to 19.5 at the end of last month from 18.6 in January. A higher VSTOXX reading suggests investors are paying up for puts that offer insurance against stock price drops. The VDAX-New®, which measures volatility in German equities, rose to 19.1 from 18.6 in January.
Automobiles Supersector leads again
The STOXX® Global 1800 Automobiles & Parts index came out on top among 20 Supersectors in the STOXX Global 1800 for a second consecutive month, with a 6% advance. The automobiles index had the worst performance of all Supersectors in 2022 following a 45.6% retreat, paced by Tesla Inc. shares.
At the other end of the table, the STOXX® Global 1800 Basic Resources index lost 8.8% in February.
Fifteen of 25 developed markets tracked by STOXX fell in February when measured in dollars. The STOXX® Developed Markets 2400 index dropped 2.3% in dollars and was flat in euros.
Fourteen of 20 national developing markets tracked by STOXX retreated in the month on a dollar basis. The STOXX® Emerging Markets 1500 index lost 4.4% in the US currency and 2.1% in euros.
Factor investing
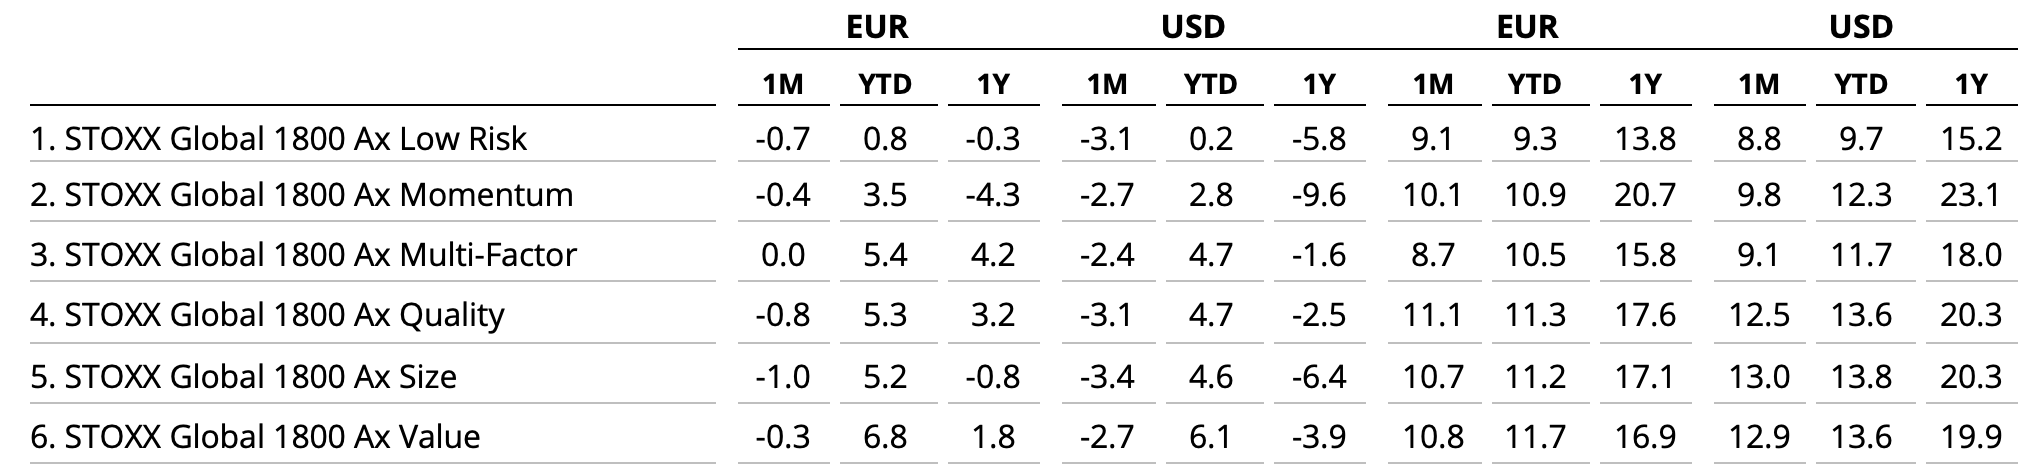
On a global basis, all style factors lagged behind the benchmark in February, according to the STOXX Factor indices. The opposite was true in Europe, where five of six signals tracked by the STOXX Factor suite outperformed the benchmark STOXX Europe 600.
Figure 4 – STOXX Factor (Global) indices’ February risk and return characteristics
Climate benchmarks
Among climate benchmarks, the STOXX® Global 1800 Paris-Aligned Benchmark (PAB) and the STOXX®Global 1800 Climate Transition Benchmark (CTB) both lost 2% in February. The PAB and CTB indices follow the requirements outlined by the European Commission’s climate benchmarks regulation.
The STOXX® Willis Towers Watson World Climate Transition Index slid 2.3% in the month. The STOXX Willis Towers Watson Climate Transition Indices (CTIs) employ a unique Climate Transition Value at Risk (CTVaR) methodology that quantifies the anticipated impact of an economic transition on equity valuations. The CTIs look beyond carbon emissions and make a forward-looking, bottom-up evaluation of asset repricing risks in a decarbonization pathway.
Among the STOXX Low Carbon indices, the EURO STOXX 50® Low Carbon (+2.1%)4 outperformed the EURO STOXX 50 by 13 basis points in February. Elsewhere, the STOXX® Global Climate Change Leaders (-3%), which selects corporate leaders that are publicly committed to reducing their carbon footprint, lagged the STOXX Global 1800 index by 74 basis points.
Sustainability indices
The STOXX® Global 1800 ESG-X index lost 2.3% in the month. The STOXX® ESG-X indices are versions of traditional, market-capitalization-weighted benchmarks that observe standard responsible exclusions.
Within indices that combine exclusions and ESG best-in-class integration, the EURO STOXX 50® ESG index gained 1.9% in February. Germany’s DAX® 50 ESG index (+0.9%), which excludes companies involved in controversial activities and integrates ESG scoring into stock selection, underperformed the benchmark DAX.
Among other STOXX sustainability families, the STOXX® Global 1800 ESG Broad Market index shed 2.2% in the month. The STOXX ESG Broad Market indices apply a set of compliance, product involvement and ESG performance exclusionary screens on a starting benchmark universe until only the 80% top ESG-rated constituents remain.
The STOXX® Global 1800 ESG Target lost 2.5%, the EURO STOXX® ESG Target rose 1.5% and the DAX® ESG Target added 1.2%. The STOXX and DAX ESG Target indices seek to significantly improve the benchmark portfolio’s ESG profile while mirroring its returns as closely as possible. Through a series of constraints, the indices implement an optimization process to maximize the overall ESG score of the portfolio while limiting the tracking error to the benchmark.
The STOXX® Global 1800 SRI fell 2.2%. The STOXX SRI indices apply a rigorous set of carbon emission intensity, compliance and involvement screens, and track the best ESG performers in each industry group within a selection of STOXX benchmarks.
Finally, the DAX® ESG Screened added 1.1% in the month. The index reflects the composition of the DAX benchmark minus companies that fail to pass norms-based and controversial weapons screenings, meet minimum ESG ratings or are involved in certain business activities considered undesirable from a responsible investing perspective.
Thematic indices
Among 25 STOXX® Thematic indices, 14 outperformed the benchmark STOXX Global 1800 last month. Gains were led by the STOXX® Global Smart Cities index.
Dividend strategies
Most dividend strategies underperformed their benchmarks last month. The STOXX® Global Maximum Dividend 40 (-2.6%) selects only the highest-dividend-yielding stocks. The STOXX® Global Select Dividend 100 (-3%) tracks companies with sizeable dividends but also applies a quality filter such as a history of stable payments.
Minimum variance
Minimum variance strategies had mixed performances last month. The STOXX® Global 1800 Minimum Variance lost 3.3% and the STOXX® Global 1800 Minimum Variance Unconstrained slid 3.6%. The strategies outperformed in Europe.
The STOXX Minimum Variance Indices come in two versions. A constrained version has similar exposure to its market-capitalization-weighted benchmark but with lower risk. The unconstrained version, on the other hand, has more freedom to fulfill its minimum variance mandate within the same universe of stocks.
1 All results are total returns before taxes unless specified.
2 Throughout the article, all European indices are quoted in euros, while global, North America, US, Japan and Asia/Pacific indices are in dollars.
3 FT, ‘US jobs total surges by over half a million in January,’ Feb. 3, 2023.
4 Figures in parentheses show last month’s gross returns.


