

Equal-weight index strategies have gained in popularity and capital flows in recent years as a way for investors to diversify risk at the stock level.
While allocating the same weight to all portfolio constituents goes a long way in hedging against drawdowns, the strategy doesn’t address concentration liabilities that arise at the industry level. A booming industry will produce a higher-than-average number of index members, an overweight stance that is unaltered by traditional equal-weight approaches.
With the aim to avoid this type of sector bias, STOXX has introduced the EURO iSTOXX® Equal Industry 50 EW Index. The gauge is comprised of the five largest companies in each one of ten Industry Classification Benchmark (ICB) industries within the broad EURO STOXX® Index. Each stock gets an equal weight.
This is STOXX’s first equal-weight industry index, targeting true diversification among the Eurozone’s business and economic sectors.
Minimizing sector concentration
In order to assess the extent of industry diversification, let’s consider the current constituency of the EURO STOXX Index, which has 307 components. There are 65 financial stocks in the index, the most represented industry. In a portfolio that’s equal-weighted at the stock level, financials would account for 21.2% of the index, compared with, for example, 3.3% for the oil-and-gas industry. This leaves the index disproportionally exposed to moves in the financial sector.
In the EURO iSTOXX Equal Industry 50 EW Index, every industry accounts for roughly a tenth of the total weight and every stock represents around 2% of the portfolio.
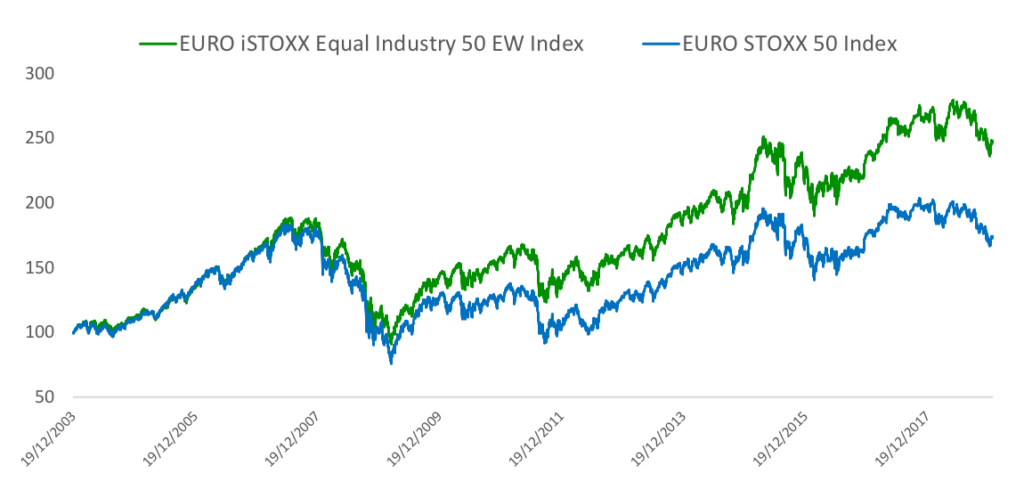
Industry diversification has led to enhanced price performance in recent years. Chart 1 compares the EURO iSTOXX Equal Industry 50 EW Index with its benchmark, the EURO STOXX® 50 Index, since data starts in December 2003. The former has outperformed the latter by 74 percentage points in the period.
Chart 1
The weak performance of banks was not only a drag on the benchmark EURO STOXX 50 during the global financial crisis – it has weighed on returns since then too. The EURO STOXX® Banks Index fell 29.7% in the five years to Jan. 9, 2019,1 as lenders suffer from bad loans and poor income ratios amid record-low interest rates. Meanwhile, the EURO STOXX Index advanced 20.6% in the period.
The outsized gains in the EURO iSTOXX Equal Industry 50 EW Index have come alongside a better risk profile too. The index’s annualized Sharpe ratio, a measure of risk-adjusted returns, stands at -0.55 for the past year and 0.54 for the past three years.2 That compares with respective ratios of -0.89 and 0.35 for its benchmark.
The EURO iSTOXX Equal Industry 50 EW Index will underlie a structured product issued by Credit Suisse.
Seeking smarter approaches in systematic investing
More and more investors are being drawn to indices with alternative weighting systems, where the construction methodology can enhance returns and improve portfolio diversification. The EURO iSTOXX Equal Industry 50 EW Index is a good example of such strategies.
Featured products
1 Net returns in euros.
2 Sharpe ratios calculated using EONIA.


