
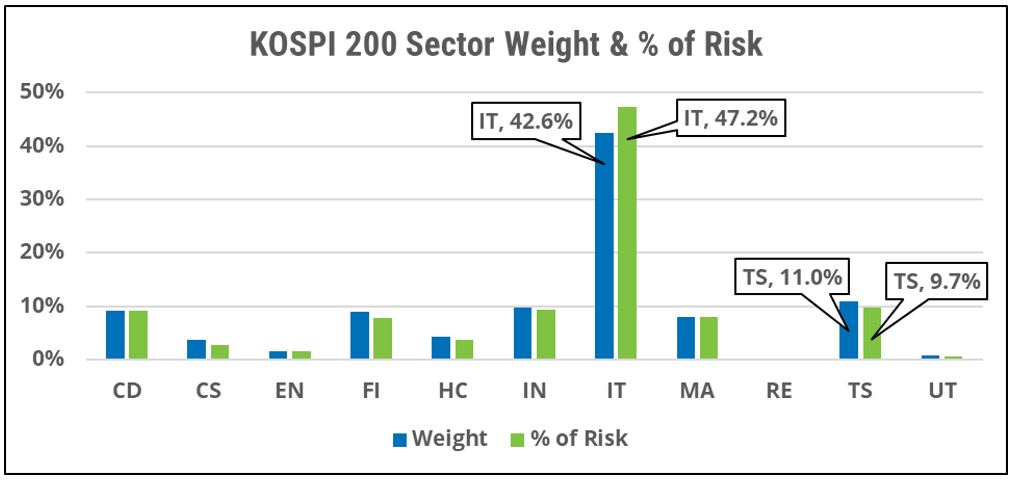
Putting all your allocation in the KOSPI 200 portfolio is essentially putting all your eggs in the Information-Technology (IT) sector basket. At almost 43% of the weight and over 47% of the risk of the index, IT dominates all other sources of return for a purely domestic investor (Figure 1). Add Telecommunication Services (TS) — the second-biggest sector, with an 11% weight and almost 10% of the risk of the index portfolio — and you have a high concentration of risk, with almost 60% of the future volatility of returns coming from just two sectors.
Technology has become an enormous part of our lives and the signs are good that it will continue to earn outsized revenues and gain an increasing share of consumers’ wallets. But even this kind of megatrend growth doesn’t always follow a straight line. After more than doubling in value over the last five years, the technology sector is facing some serious headwinds in the form of multi-decade high inflation, ongoing global supply-chain disruptions from the COVID-19 pandemic, rising interest rates (both at home and across major currencies), increased regulatory scrutiny, and a highly unpredictable geopolitical environment.
To put today’s market environment into historical context, we must go back to the tech bubble of the late 1990s and its subsequent bursting in the early 2000s. Unfortunately, the first large-cap technology stock to be listed in Korea was in 1999, which does not give us much of history to look at. So, to mimic what could happen to today’s tech-dominated Korean market portfolio, assuming a replay of the tech bubble burst of 2000, we superimposed the cumulative returns of the Korean large- and medium-cap universe of stocks onto the US Technology sector of the late 1990s (Figure 2). This is appropriate given the current trailing 90-day correlation between the two of 0.9.
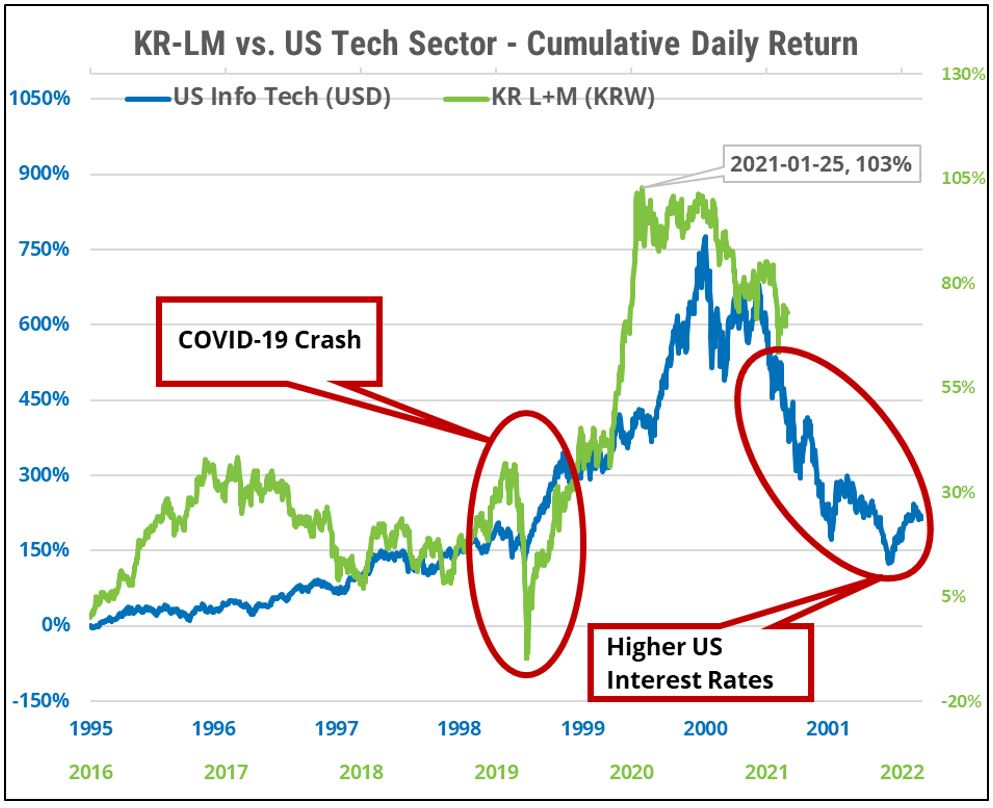
The green line represents the cumulative daily return of the large- and medium-cap segments of the broad Korean market. Even with the sharp correction from the COVID-19 crash of March 2020, the value of the portfolio has more than doubled (103%), driven mostly by the rise of IT stocks. But this rally peaked in January 2021, the index then remained flat for most of that year and has now started to decline with the US Technology market.
The blue line in Figure 2 represents the cumulative return of the US IT sector from 1995 to the end of 2001, after the bubble burst in 2000. The macro-environment at the start of 2000 was similar to now. In a recent post on the US Technology sector, Diana R. Baechle, Ph.D. of Qontigo’s Applied Research Team, noted that:
“The Fed played a significant role in the formation of this bubble by cutting interest rates in the mid-1990s. The Fed had a role not only in aggravating the dot-com craze, but also in the bursting of the bubble through the tightening of monetary policy. The Fed increased interest rates multiple times in 2000, with the Federal Funds Effective Rate reaching 6.5% in May 2000—the highest level since 1991. The Fed lowered interest rates aggressively in 2001 to boost the US economy, with the Effective Rate dipping below 2% by the end of the year, when the US came out of the recession.”
On March 16, the Federal Reserve raised the key interest rate for the first time since 2018, to 0.25%-0.5%, and projected six additional 0.25 percentage-point increases this year to fight inflation. In general, higher interest rates are bad news for both Growth and Technology stocks because they raise the rate at which their future earnings are discounted to estimate their current fair value. This means that the current high valuations will be downgraded as interest rates rise. Another worry for investors is the impact that some of these macro headwinds will have on the global economic expansion. Technology spending by consumers is closely tied to economic growth. Therefore, a slowing economy is bad news for the sector, which depends on discretionary spending for much of its revenue. With US interest rates already at historically low levels and inflation at a multi-decade high, it is unlikely that the Fed can be of much help to the economy, should the bubble burst again. This makes a potential tech sell-off even more threatening for investors today and raises the case for diversification away from a Technology-concentration risk.
The case for the DAX Index
Korea and Germany share much in terms of their economic strengths. Both are heavily industrialized countries, both are product-oriented economies, and both rely on exports for growth. One could argue that an economic scenario that is good news for Germany is also likely to be good news for Korea. Where the two countries differ, however, is in the make-up of their stock markets.
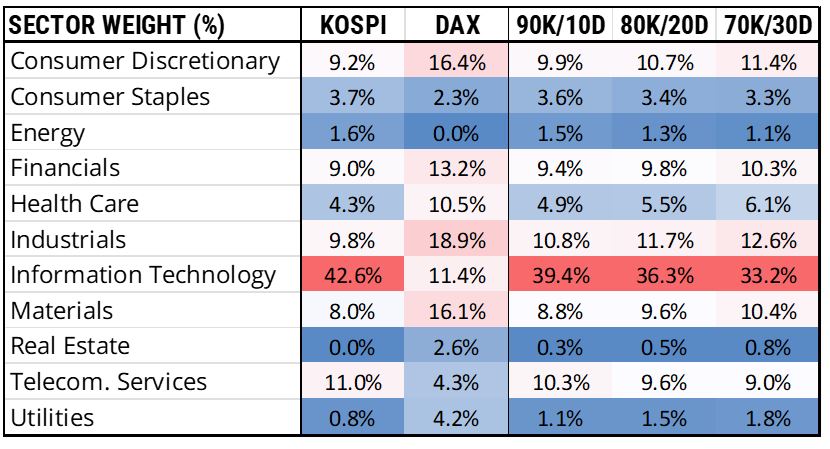
As noted above, the Technology sector comprises over 40% of the KOSPI 200 portfolio, but its weight in the DAX® Index is about a quarter of that, at just over 11% (Figure 3). The largest sector in the DAX portfolio is Industrials at 19% of the weight and 21% of the risk (less than half of the influence of the Tech sector on the KOSPI 200 portfolio). The next three sectors by weight are Consumer Discretionary (16.4%), Materials (16.1%) and Financials (13.2%).
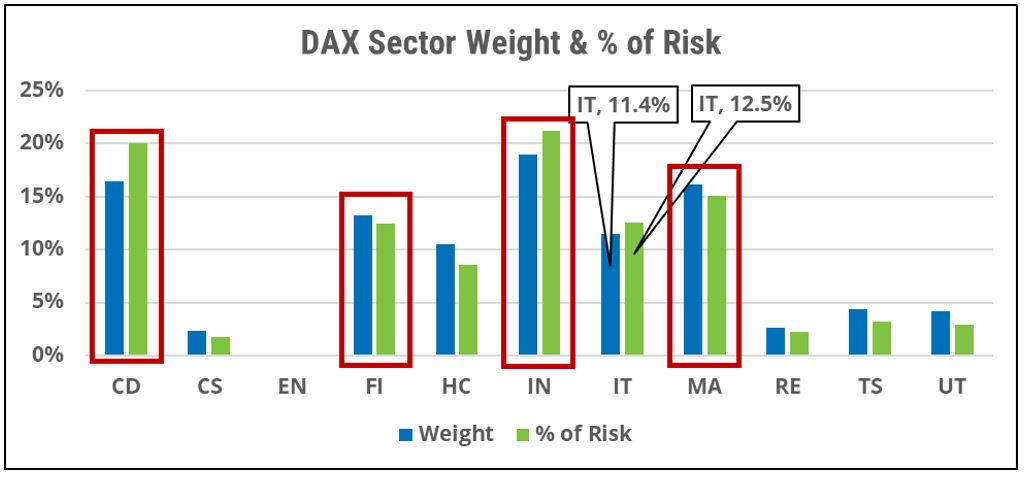
Although the COVID-19 health crisis seems to be moving from a pandemic to an endemic stage, the ongoing discovery of newer variants, each more transmissible than the last, makes it likely that the Health Care sector will remain central to the world’s ability to put this crisis behind us for some time to come. Hence Health Care might be a good candidate when thinking about ways to reduce the Technology exposure. Health Care is only 4% of the KOSPI portfolio, but it is over 10% of the DAX, giving us another reason to add this exposure to our investment plan.
Diversification in action
Considering the above, we simulated an investment that gradually increases the allocation to the DAX portfolio. The table below (Figure 4) highlights what happened to our sector-concentration risk with these new investments. The first two columns are the original sector allocations of both indices discussed above. The next three columns show the sector weights for the various allocation levels across the two portfolios. As we increase our allocation to DAX, we diversify away some of the Technology-sector concentration risk from our original 100% KOSPI investment. We also increase our exposure to other sectors that might benefit from the new macro environment, such as Financials, Materials, Health Care and Utilities.
Conclusion
It is said that while history does not always repeat itself, it often rhymes. Given the current 0.90 rolling correlation between the KOSPI and the NASDAQ Composite Index, the IT concentration in the KOSPI 200 portfolio is a source of concern. Domestic investors with 100% of their assets invested in the Korean benchmark may want to consider some international diversification to reduce their high sector-concentration risk.


