

Infrastructure assets can provide protection in an inflationary and rising interest-rate environment, as they present a certain price inelasticity of demand. In addition, the holding companies are often monopolistic in nature, helping them maintain reliable levels of revenue and profit margins even in a slowing economy.
Diana Baechle
Diana is a Principal at Qontigo and part of the Applied Research team in New York. Her research is focused on equites and she regularly publishes market commentary, blog posts and whitepapers on current market events, the risk environment, and recent equity trends.
The STOXX® Global Broad Infrastructure index tracks companies that derive a significant part of their revenues from infrastructure activities, thus providing a systematic, transparent and rules-based way of capturing the underlying returns.
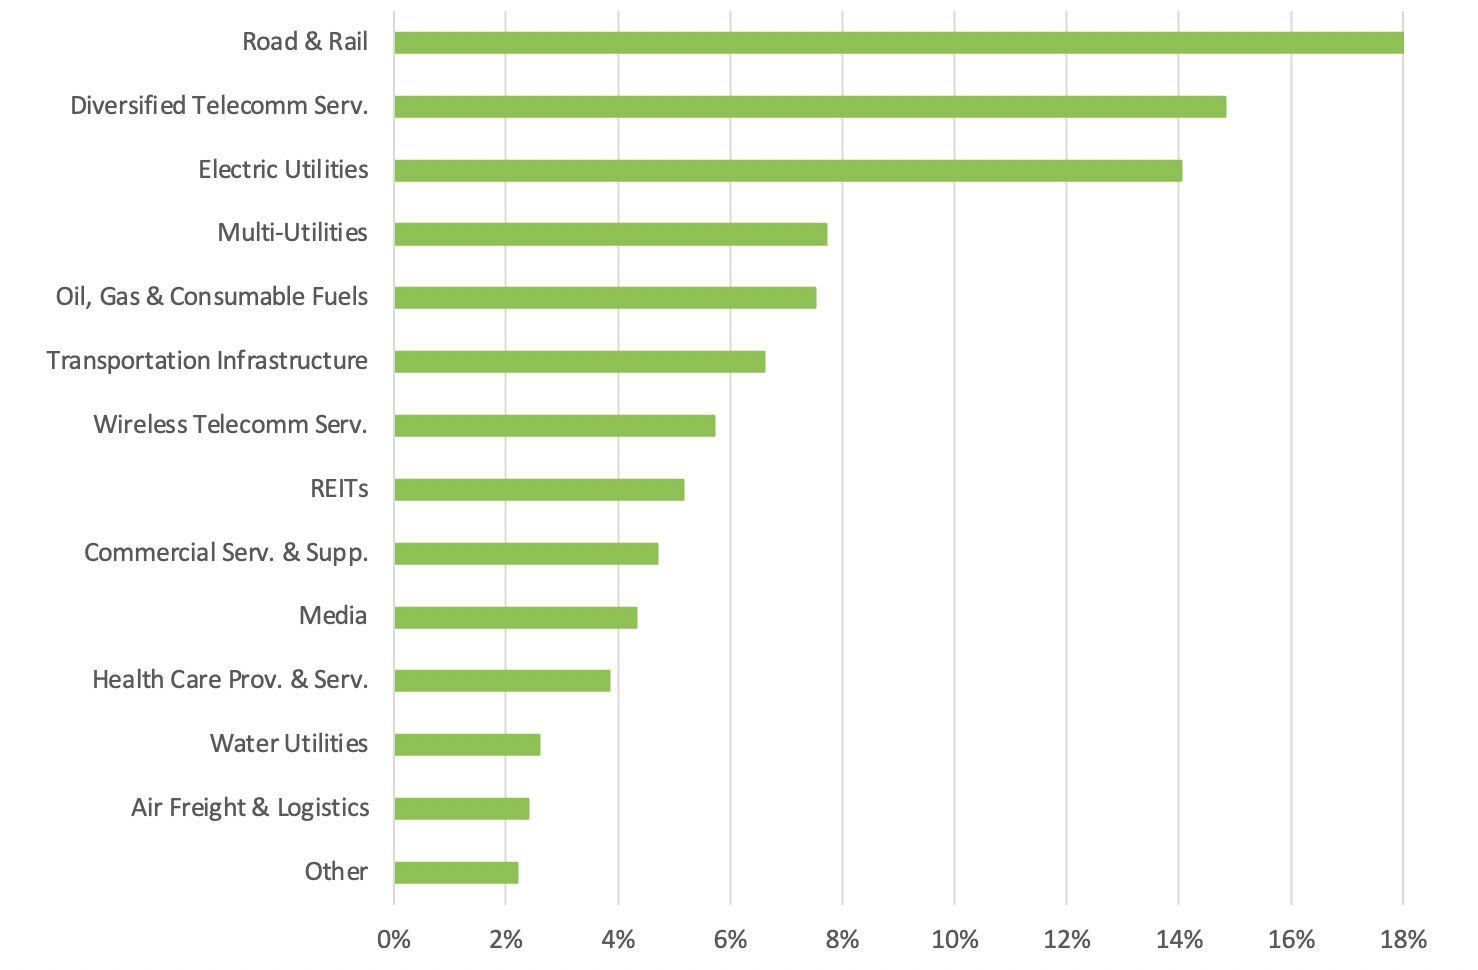
Figure 1 shows a breakdown of the industries covered by the index, of which Road & Rail, Diversified Telecommunication Services and Electric Utilities make up nearly 50%.
Figure 1 – Industry allocation
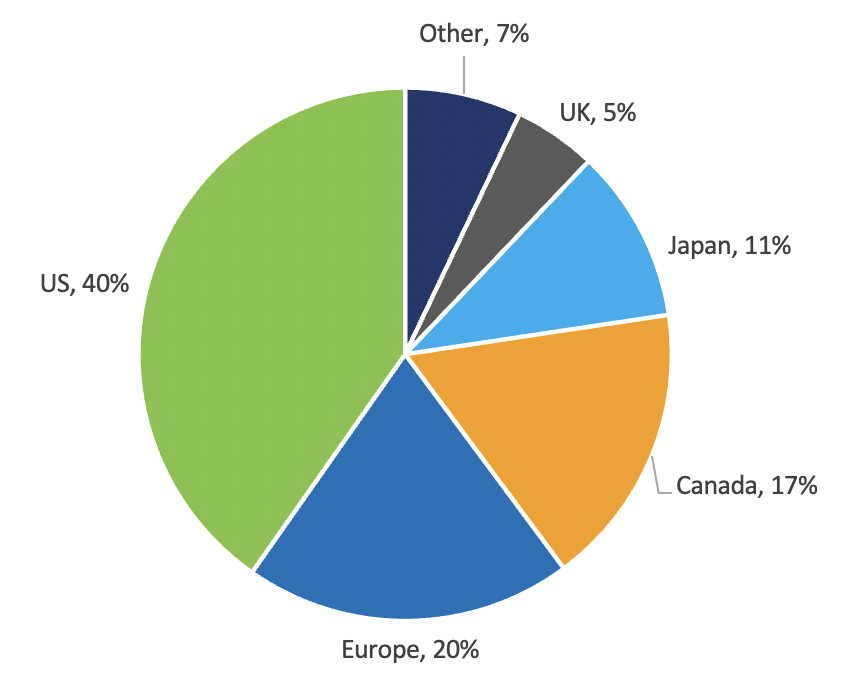
The STOXX Global Broad Infrastructure index comprises companies located in the US (40%), Europe (20%), Canada (17%), Japan (11%) and the UK (5%), with other countries each having less than a 2% representation in the index (Figure 2).
Figure 2 – Country/region allocation
Sensitivity to inflation
The inflation factors in Axioma’s Macroeconomic Projection Model capture the sensitivities to daily changes in the 5-year breakeven inflation rates [1] in the US, UK and Europe, representing the sensitivity of the index to expectations of accelerating prices in these regions. Stock returns are typically impacted by expectations for future levels of macroeconomic indicators (rather than current levels), and therefore, these risk factors are well suited to capture the effect of changes in inflation expectations on equity portfolios.
Factor exposures
Since its inception in October 2013, the Infrastructure index has exhibited positive average exposures to expected inflation in all three regions.[2] This means that an increase in inflation expectations (i.e., positive return of the inflation factors) would translate into positive contributions to the index return.
In this study, we focus our attention on the past three years (2020-2022), when expectations for higher inflation worldwide flared to levels not seen in decades.
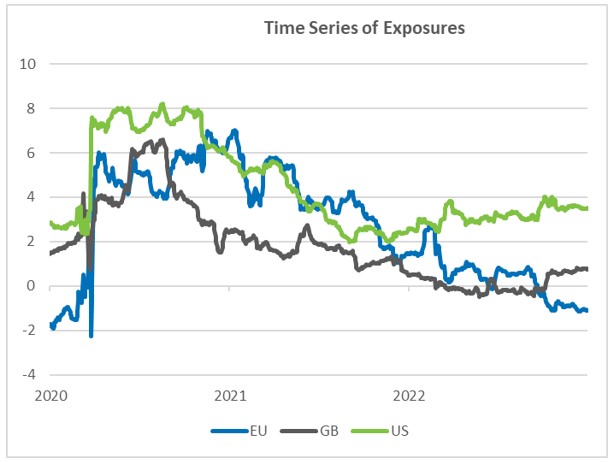
The factor exposures chart in Figure 3 (left chart) shows the time series of daily exposures to US, UK and Europe expected inflation between 2020 and 2022. The average daily exposures have been significantly positive in each region for most of the period. That is, the index stood to benefit from a rise in expected inflation, particularly in 2020 and 2021, when faster consumer prices growth was seen as a sign of stronger economies in the aftermath of the pandemic.
Sign up to receive valuable insights, news, and invitations as soon as they are published.
Subscribe >Factor returns
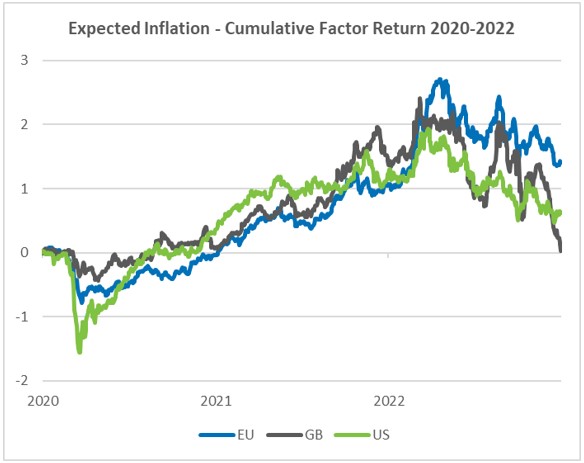
The chart at the center in Figure 3 shows the cumulative return for the three expected inflation factors between 2020 and 2022. Expectations for higher inflation climbed throughout 2021, when the pandemic relief efforts flooded economies with liquidity, receiving a further boost from soaring energy costs following the Russian invasion of Ukraine in early 2022. This is reflected in the upward path of the cumulative factors’ returns.
Central banks have made a concerted effort to bring down inflation since last year, and therefore investors started to anticipate a decline in the inflation rate. This is captured by the drop in the factors’ cumulative returns in 2022. Despite this recent abrupt decline, the three-year cumulative factor returns have remained positive in the US and Europe and neared zero in the UK as of Dec. 30, 2022.
Factor contributions
The combination of positive exposures and positive changes in expected inflation for most of the 2020—2022 period resulted in a positive contribution to the overall index’s return in all three regions. This confirms that the index proved to be a good hedge against rising expected inflation during this period.
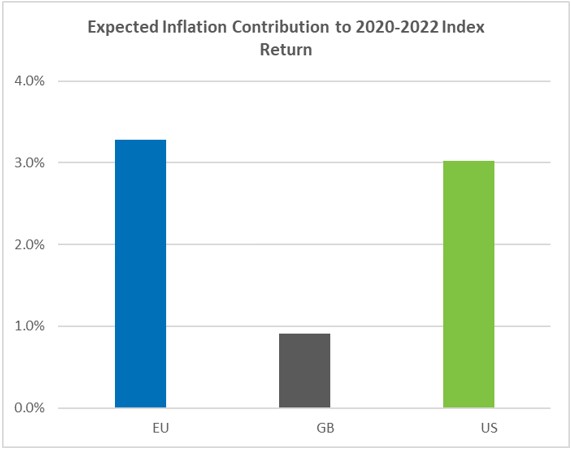
The increase in Europe and US expected inflation contributed the most to the 2020—2022 index return (right-hand chart in Figure 3). This is not surprising given that 60% of index assets are located in these two regions, with both regions seeing positive average exposures to expected inflation and positive factor returns.
Figure 3 – Exposures, factor returns, and factor contributions (2020-2022)
Factor exposures
x
Factor returns
=
Factor contributions
Source: Qontigo.
Note however, that the index’s exposure to Europe’s expected inflation turned negative in the fourth quarter of 2022 (Figure 3, first chart), indicating that an increase in Europe’s expected inflation would currently hurt the index. As expectations for inflation kept rising, it became a negative indicator for investors, as much higher prices can negatively affect economies.
The index, on the other hand, maintained positive exposures to US and UK expected inflation at the end of 2022, suggesting that the index would still gain from a potential rise in expected inflation in those markets.
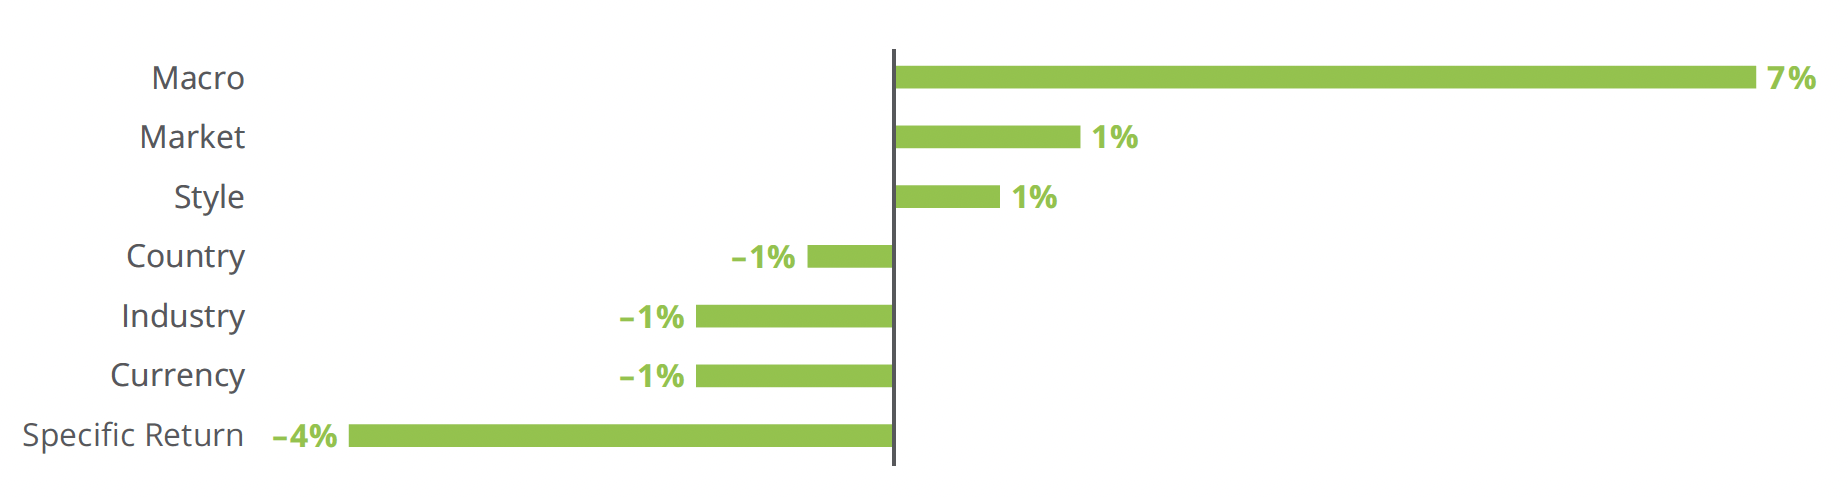
In aggregate, Macro factors — which include Expected Inflation factors — had the largest positive contribution to the index’s 2020-2022 return (Figure 4). Specific and Currency factors had the largest negative impact, dragging the overall return down to 1%.
Figure 4 – All factor contributions
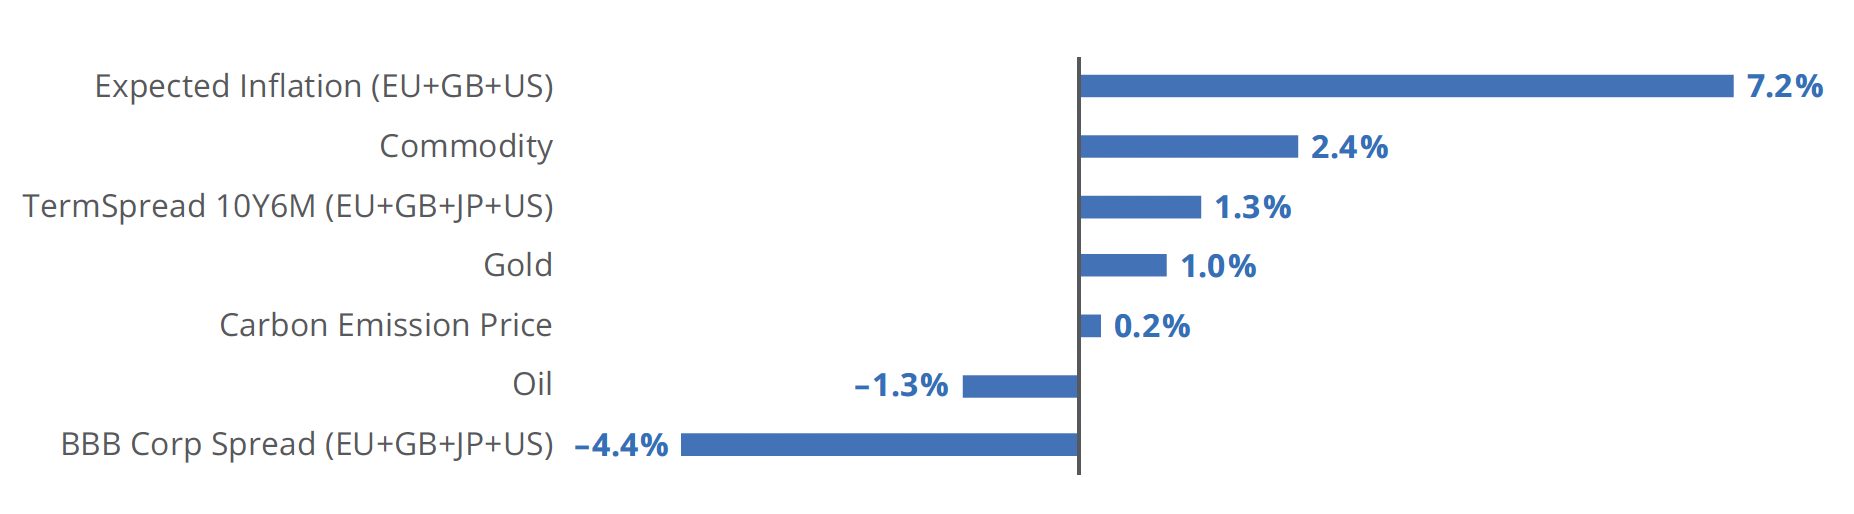
Digging deeper into the Macro factors, the US, UK and Europe Inflation factors contributed 7.2 percentage points to the index return over the period (Figure 5).
Figure 5 – Macro factor contributions
In summary, the STOXX Global Broad Infrastructure was a clear inflation hedge during 2020-2022, a period characterized by a record increase in consumer prices and inflation expectations. This is in line with what academia and perceived knowledge tell us, but we have backed it up as well with a macro risk model analysis. Infrastructure assets may, therefore, have a role to play in portfolios in a world where inflation may prove to be a tough battle to fight for monetary authorities.
[1] The 5-year breakeven inflation rate represents a measure of expected inflation derived from 5-Year Treasury Constant Maturity Securities (BC_5YEAR) and 5-year Treasury Inflation-Indexed Constant Maturity Securities (TC_5YEAR) (Source: FRED).
[2] Analysis was performed as of Dec. 30, 2022.


