

The violent market pullbacks that many traders had gotten used to living without are back. The STOXX® Global 1800 Index plunged 7.5%1 between Feb. 2 and Feb. 8, its steepest five-day decline since August 2015.
A widely cited reason for the downtrend has been the jump in U.S. bond yields, which puts pressure on asset and financial returns. Some have also pointed to products that bet against an increase in volatility as having exacerbated the sell-off.2 Others simply say that, following a record-breaking run in recent months, a market correction was due.
Within this unusual market stress, let’s look at the performance of a portfolio of equities constructed with the aim of fending off volatility better than a market-capitalization portfolio. We’ll consider a minimum-variance strategy, also known as an efficient portfolio with minimal risk.
An optimized minimum variance portfolio
The STOXX Minimum Variance indices represent a universe of stocks that are far less volatile than those tracked by traditional market-cap-weighted indices. But not only do they track the stocks that have exhibited the lowest individual levels of historical volatility; they also take correlation risk into account. The STOXX Minimum Variance indices use a risk model based on factors such as leverage, liquidity and momentum to estimate a covariance matrix and construct the optimal minimum variance index.
The STOXX Minimum Variance Indices come in two versions: constrained and unconstrained. The former have a similar exposure to a market-cap index but with much lower risk. The unconstrained version, on the other hand, has complete freedom to fulfill its minimum variance mandate. For a PULSE ONLINE article on the indices, please click here.
Table 1 shows the performance of the STOXX Global 1800 index against its minimum variance constrained and unconstrained versions, between Feb. 2 and Feb. 8, 2018. We include a similar analysis for the STOXX® USA 900 Index, since volatility seems to have started in U.S. markets.
Minimum Variance outperformed by as much as 1.6 percentage points over the five days, meaning the strategies did what they are supposed to do – limit the move down.
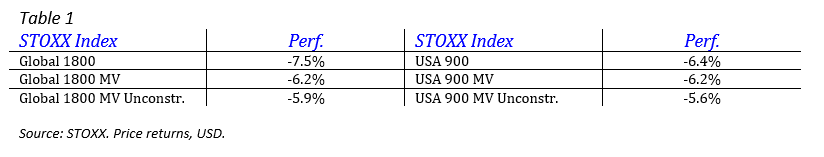
To put the returns in context, let’s look back at the performance since the last day of 2016. Chart 1 shows that on Jan. 26, 2018, the market-cap STOXX Global 1800 reached its maximum outperformance to a minimum variance strategy in the period considered. It beat the minimum variance constrained and unconstrained versions by 7 and 8 percentage points on that day, respectively. This outperformance may have paved the way for the larger declines in the benchmark seen since Feb. 2.
Two possible explanations for the underperformance of minimum variance during the recent rally lie in the composition of minimum variance indices. Firstly, low-volatility indices lack the steam of high-beta momentum stocks. Large new-economy stocks that have led gains in the US in recent years, such as Amazon.com, Alphabet and Facebook, are absent from STOXX’s minimum-variance indices.
Then there is the larger allocation that low-volatility portfolios accord to relatively stable utility stocks. These companies have suffered in recent quarters as rising bond yields erode the comparative appeal of their dividends.
Low volatility anomaly
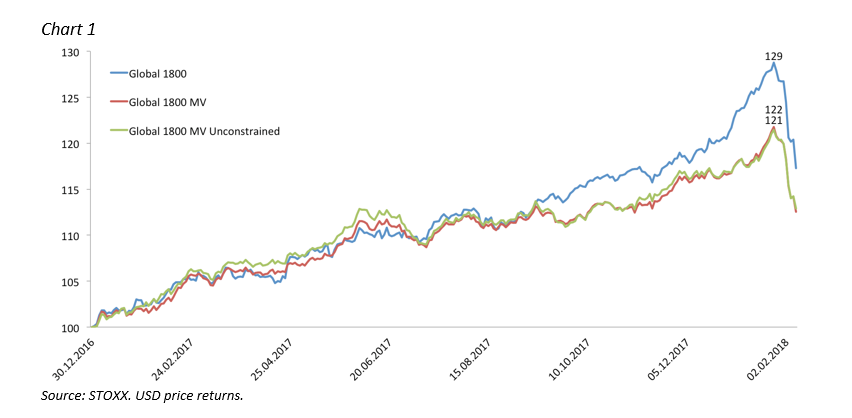
In the longer term, however, minimum variance tends to outperform over entire cycles due to the so-called low volatility anomaly. Chart 2 shows the performance of the Global 1800 index and its two minimum variance versions since 2007.
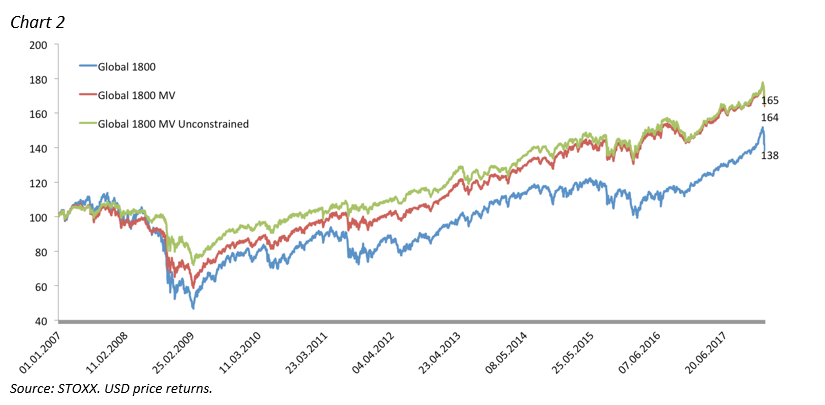
Chart 2 also displays how Minimum Variance helped reduce the drawdown in the global financial crisis. From Jan. 1, 2007 to the depths of the crisis in March 2009, the Global 1800 index plunged as much as 53%. That compares with a drop of 41% for the Global 1800 Minimum Variance constrained index and a 28% decline for the unconstrained index.
A shift in market sentiment?
Low volatility portfolios proved their stature during the global financial crisis, before their merit was overshadowed by returns from riskier stocks. It may be time to put them back at the forefront.
Featured indices
1 Price return in USD.
2 Mohamed A. El-Erian, ‘10 Things to Know About the Stock-Market Selloff,’ BloombergView, Feb. 9, 2018.


