With more asset owners and investors adopting net-zero objectives, a first question that arises is that of how much it costs to transition a portfolio from “brown” to “green.”
A new whitepaper[1] from ISS LiquidMetrix and STOXX seeks to answer this question by analyzing the trading costs involved in such a shift. The authors consider the cost of moving a standard holding of European equities as defined by the STOXX® Europe 600 to two versions of the index that comply with the European Union Climate Benchmarks regulation: the STOXX® Europe 600 Paris-Aligned Benchmark (“PAB”) and the STOXX® Europe 600 Climate Transition Benchmark (“CTB”).
CTBs and PABs follow EU provisions in terms of decarbonization trajectory, activity exclusions and sector exposure constraints. The two benchmark types differ in their level of restrictiveness and ambition. CTBs form a portfolio that is on a decarbonization trajectory, while PABs incorporate more stringent carbon limitations (“darker green”) that are in line with Paris Agreement global warming commitments.
In order to have a reference for a ‘typical’ (non-green) transition, the analysts also measure the cost of moving the benchmark to another standard index: the STOXX® Developed Europe.
The authors compare the cost of transitioning a EUR 3.5-billion portfolio to the three alternative variants, with four trading strategies at different degrees of aggressiveness: trading the transition at 5%, 10%, and 20% market participation rates[2], as well as using a full-day volume-weighted average price (VWAP) trading strategy. The ISS LiquidMetrix Pre-Trade Cost Estimate model[3] is used to forecast the costs.
The cost of transitioning: impact and risk
The estimated trading cost is made up of two components: impact and risk cost. Impact is the cost associated with aggressive trading, crossing the market spread to secure the shares, and thereby raising the price. The more aggressive the trading (a higher participation rate) the greater the impact cost. The risk cost, meanwhile, is the cost from the price moving away. The longer it takes to complete the order (a more passive, smaller market participation rate), the higher the cost associated with risk.
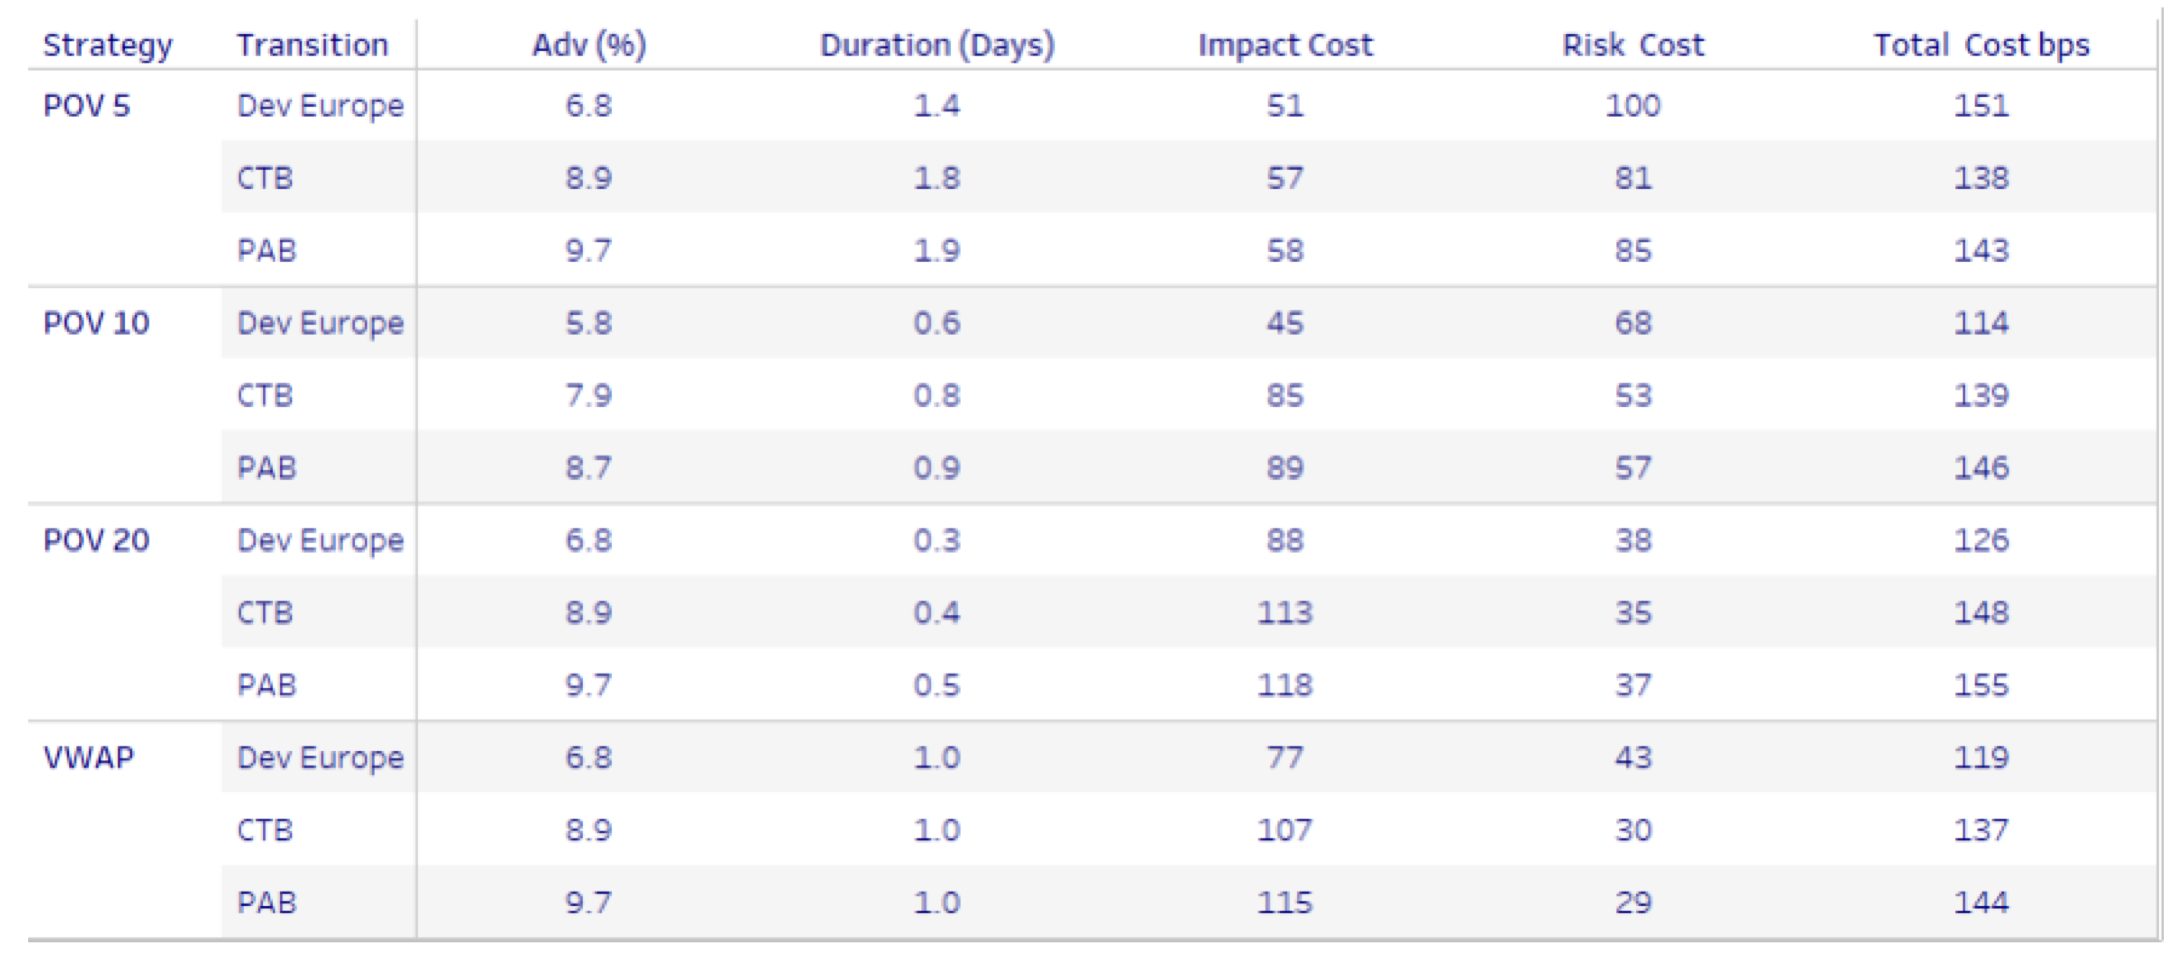
Figure 1 from the whitepaper shows the analysis’ results. The composition of the total cost varies significantly depending on how aggressive the trading strategy is. Similarly, the weight of the components of implementation costs (impact + risk) vary.
While an ultra-passive 5% participation trading strategy provides lower impact costs, it carries a greater risk cost associated with overnight price movements. Conversely, a 20% participation strategy has a large impact cost but a lower associated risk cost as the time needed to complete the order is less.
Figure 1: Trading Cost Overview

Overall, the 10% market participation strategy provides the lowest cost for implementing all three target portfolios, and the 5% participation the highest.
Sign up to receive valuable insights, news, and invitations as soon as they are published.
Subscribe >Comparing costs
A key conclusion is that transitioning to a green index portfolio is generally more expensive — between 15% and 20% more — than moving to a similar reference portfolio (i.e., the Developed Europe index). However, there is little difference in transition costs between a “green” versus a “greener” portfolio — stimulating potential moves to the latter. The exception happens when implementing an ultra-aggressive 20% participation strategy, where there is only a slightly higher cost in moving to a PAB rather than a CTB portfolio.
Interestingly, using a 5% market participation trading strategy, the costs of transitioning to the “green” or “greener” portfolio are less than the cost of the reference transition. While the impact of trading passively is similar for all three benchmark indices, there is more price volatility risk in the Developed Europe portfolio.
Cost vs. exposure comparison
Further, the authors also look at the cost of transitioning vs. the level of “green” exposure obtained, another factor to be considered when determining the rationale of shifting portfolios.
For example, transitioning from the STOXX Europe 600 benchmark to a “greener” PAB portfolio at a 10% market participation strategy, generates a marginal cost of 7 basis points, or 6%, relative to transitioning to the “green” CTB benchmark. This additional cost, however, is accompanied by a further 14% reduction in climate emissions intensity relative to the benchmark.
The importance of transaction costs
With sustainable investing moving mainstream in Europe and elsewhere, a lot has been written about the tradeoffs investors need to consider when shifting to a climate policy. Much of this literature, however, has been focused on investment risk and exposures. The latest whitepaper, on the other hand, turns the attention to transaction costs.
“Transaction cost analysis is a critical part of any transition planning,” the publication’s authors write. “There are unique insights, however, that can be drawn from incorporating a cost-aware view among traditional risk/exposure analyses. Our case study highlights the potential cost efficiency of darker green portfolios, which also varies depending on the trading method chosen.”
The combination of unique datasets, portfolio construction techniques and analytics is at the heart of many recent innovations in financial services, the authors add. With those tools at hand, investors can make better-informed decisions when shifting strategies.
[1] ISS LiquidMetrix, STOXX, “The Cost of Going Green(er),” November 2023.
[2] The market participation rate is based on Percent of Volume (PoV), a trading algorithm based on a security’s market volume. A PoV threshold is used to execute bigger orders without having an excessive impact on the price.
[3] Part of ISS STOXX, ISS LiquidMetrix provides trading performance, surveillance and venue statistics research services to a whole range of financial clients.


