
Increasing awareness and new regulation are among factors making of biodiversity loss an emerging concern for many investors. At the same time, new ways of measuring companies’ nature-related footprint are helping those investors assess the challenges that arise from both the deterioration and preservation of our land, water and species.
The move to protect our habitats raises the regulatory liabilities for corporates and investors, already facing biodiversity-related physical, transition and systemic risks.[1] Biodiversity plays a vital role in supporting life on earth, and enables economic and industrial development. To cite two examples, around 75% of global food crops rely on pollination, and one-quarter of all the drugs used in modern medicine come from nature.[2]
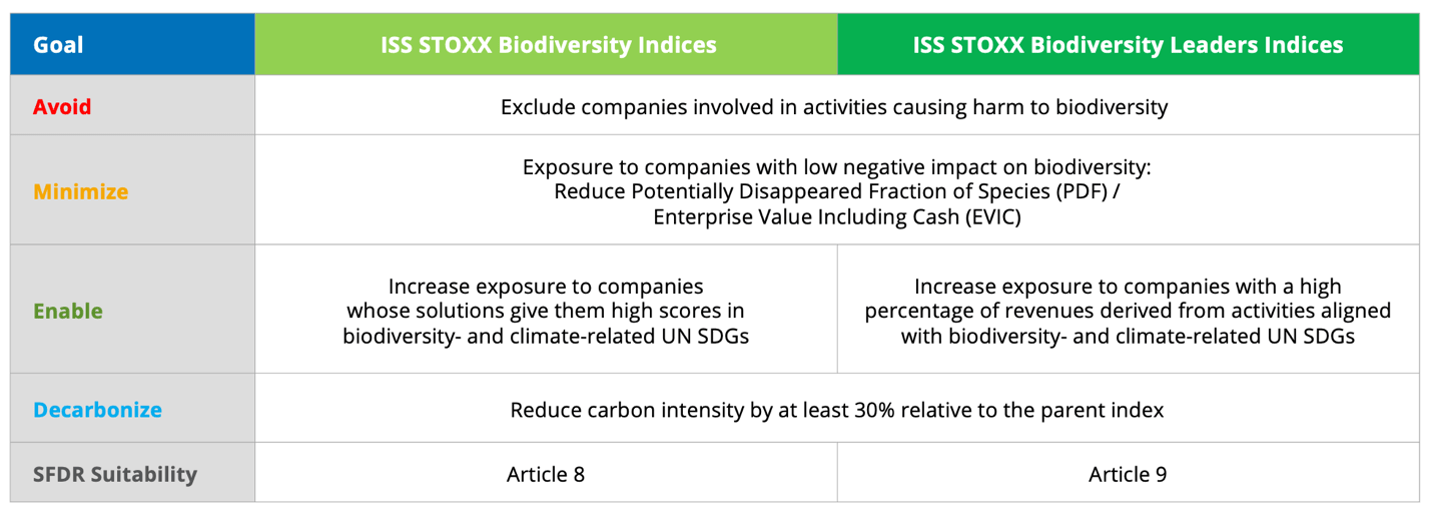
The ISS STOXX® Biodiversity indices were introduced in April this year, offering a comprehensive approach to integrate biodiversity challenges into investment portfolios. The indices address three different biodiversity goals and incorporate an additional climate objective (Figure 1). They exclude companies involved in activities that are controversial or cause harm to biodiversity, select securities with less negative impact on ecosystems and those contributing positively to relevant UN Sustainable Development Goals (SDGs). They also reduce the portfolio’s carbon emissions.
The indices are classified into two categories: “Biodiversity” and “Biodiversity Leaders.”[3] The former tilt exposure to companies with high scores in seven biodiversity- and climate-related SDG objectives, while the latter include companies with high revenues derived from activities aligned with SDGs.[4]
Figure 1: ISS STOXX Biodiversity indices framework
Sign up to receive valuable insights, news, and invitations as soon as they are published.
Subscribe >Looking into a biodiversity-focused portfolio construction
A new STOXX report[5] explores the rationale behind integrating biodiversity considerations in an investment process and reviews what metrics are available to measure companies’ biodiversity impact. The authors then describe in detail the four steps in the ISS STOXX Biodiversity indices’ process, explaining how each step was put together and why certain measures were taken during index construction. Finally, they provide the results of implementing the strategy.
The report may be of particular interest to investors considering applying a biodiversity focus or framework to portfolios. The main goal of the ISS STOXX Biodiversity suite is to enable the allocation of capital to companies with more sustainable practices and a lower biodiversity impact compared to peers. The framework can be used to customize and optimize existing indices, incorporating additional objectives and constraints.
Measuring companies’ nature impact
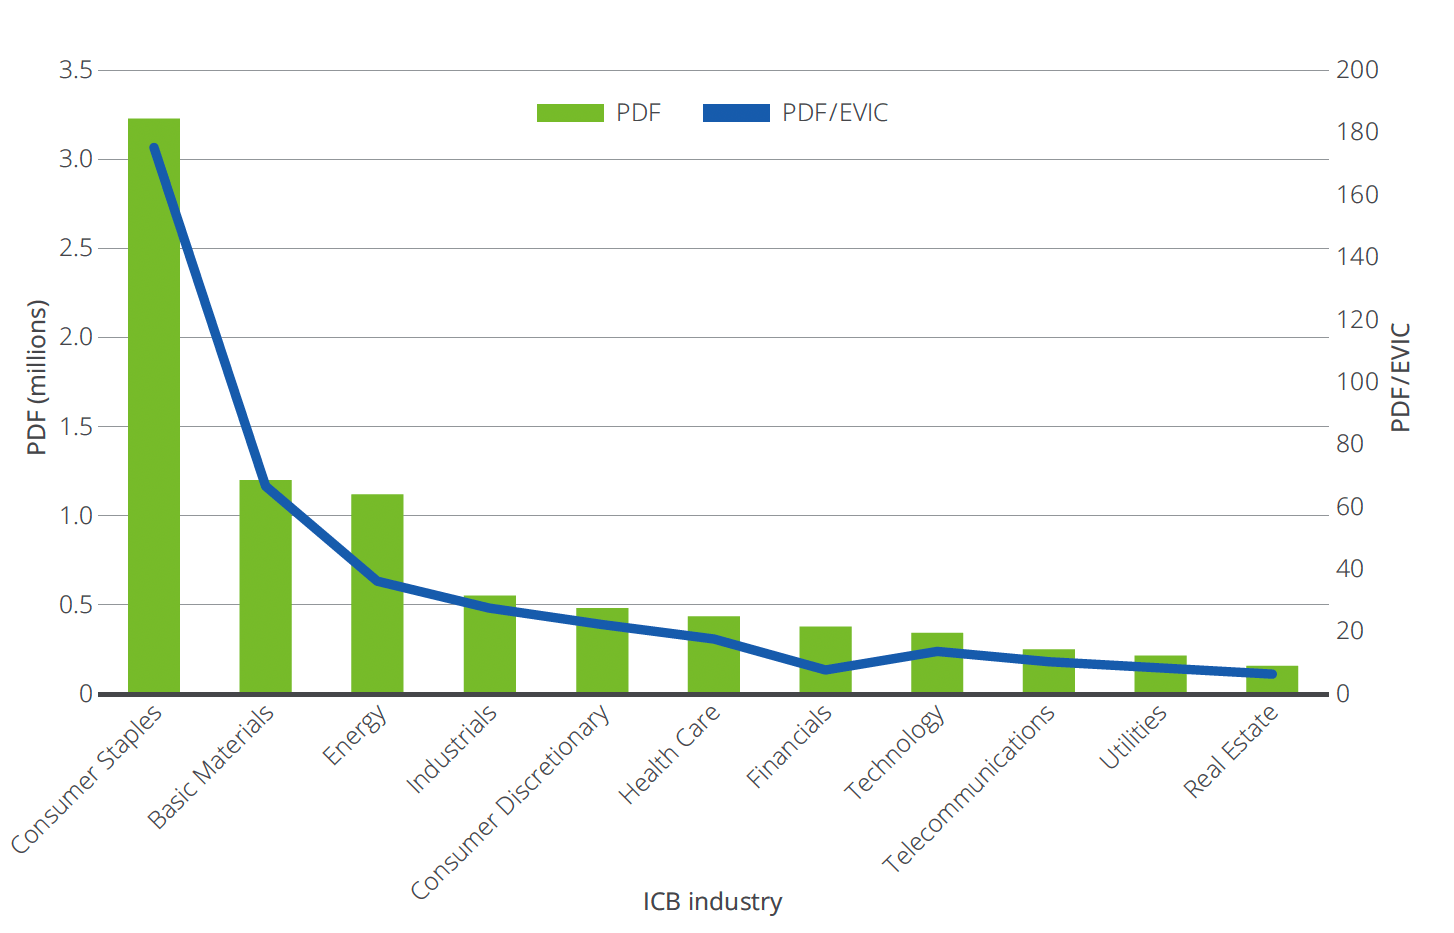
A key component of the ISS STOXX Biodiversity framework is the Potentially Disappeared Fraction of Species (PDF)[6], an output of ISS ESG’s Biodiversity Impact Assessment Tool. PDF seeks to measure how corporates affect our natural world by considering a set of environmental pressures on species and habitats across the entire value chain and different geographical locations.
PDF is divided by each company’s Enterprise Value Including Cash (EVIC) to avoid size biases (Figure 2). The indices select the top 80% companies in each ICB Sector by PDF/EVIC.
Figure 2: Average PDF vs. PDF/EVIC – An industry comparison.
Improvement in SDG exposures
The publication also presents an analysis of average SDG ratings per business sector. In the ISS STOXX Biodiversity indices (broad versions), 34 of 43 sectors have a negative average rating. However, 13 of those 34 improve to a positive rating when a top 80% SDG rating selection is applied.
On the other hand, a sector with a high SDG Solutions Score[7] may not necessarily provide the most index constituents once we consider only companies that derive at least 20% of their revenues from products and services that make an overall positive net contribution to selected SDGs. Such a filter appears in the ISS STOXX Biodiversity Leaders indices and is intended to comply with the Article 9 classification of the Sustainable Finance Disclosure Regulation (SFDR).
Performance comparisons
Figure 3 also comes from the report and illustrates the improvements achieved in the biodiversity-related objectives of the indices. The table shows that the indices significantly improve both the overall PDF and SDG scores, and also surpass the 30% carbon footprint reduction target.
Figure 3: ISS STOXX World AC indices’ metrics vs. benchmark

Source: ISS ESG and STOXX as of June 2023. From “ISS STOXX® Biodiversity Indices: How to Incorporate Biodiversity Considerations in Index Construction.”[8]
A more prominent feature of the investment process
As the authors write, capturing biodiversity risks and opportunities is becoming a more prominent feature of the investment process. With a transparent and systematic framework and better data available, investors can aim to effectively incorporate biodiversity considerations in portfolio construction.
We invite you to download and read the report here.
[1] Physical risks include the loss of raw materials and disruption of operating environments. Transition risks cover policy shifts, change in market preferences and voluntary commitments. Systemic risks mean things such as global pandemics. Regulatory or litigation risks include increasing legislation.
[2] World economic Forum, “Nature Risk Rising: Why the crisis engulfing Nature Matters for business and the economy,” 2020.
[3] The standard Biodiversity category includes indices that cover the World All Countries, Developed World, Europe 600, Developed Europe, US, Asia-Pacific and Emerging Markets regions. The Biodiversity Leaders category indices cover the World All Countries region.
[4] ISS ESG’s SDG Impact Rating provides a holistic measurement of a company’s positive or negative impact on the 17 SDGs across more than 100 data factors. Companies are rated on a scale of -10 (significant negative impact) to +10 (significant positive impact).
[5] STOXX, “ISS STOXX® Biodiversity Indices: How to Incorporate Biodiversity Considerations in Index Construction,” October 2023.
[6] PDF quantifies the potential decline in species richness in an area over a defined period due to unfavorable conditions associated with environmental pressures. Species richness refers to the number of unique species in an area. Another metric that is available for inclusion in the framework is the Mean Species Abundance (MSA). MSA quantifies the mean abundance of original species relative to their abundance in undisturbed ecosystems. Species abundance refers to the total number of organisms in a given species.
[7] In the ISS STOXX Biodiversity Leaders indices, companies are assessed in accordance with their revenues’ exposure to activities that are aligned with selected SDGs, and are assigned an SDG Solutions Score. The Score measures the positive and negative sustainable contributions of the companies’ products and services to the goals.
[8] Biodiversity SDG Rating: Companies are assessed on the basis of their contribution to biodiversity- and climate-related UN SDGs. Revenue exposure to Biodiversity SDGs is based on the share of revenues a company derives from products and services identified as contributing to the achievement of a given objective, and ranges from 0% to 100%. SDG Solutions Score: see [7]. WACI stands for weighted-average carbon intensity.


