

Stocks rose in July amid signs that global inflation is easing and that the US economy may avoid a recession.
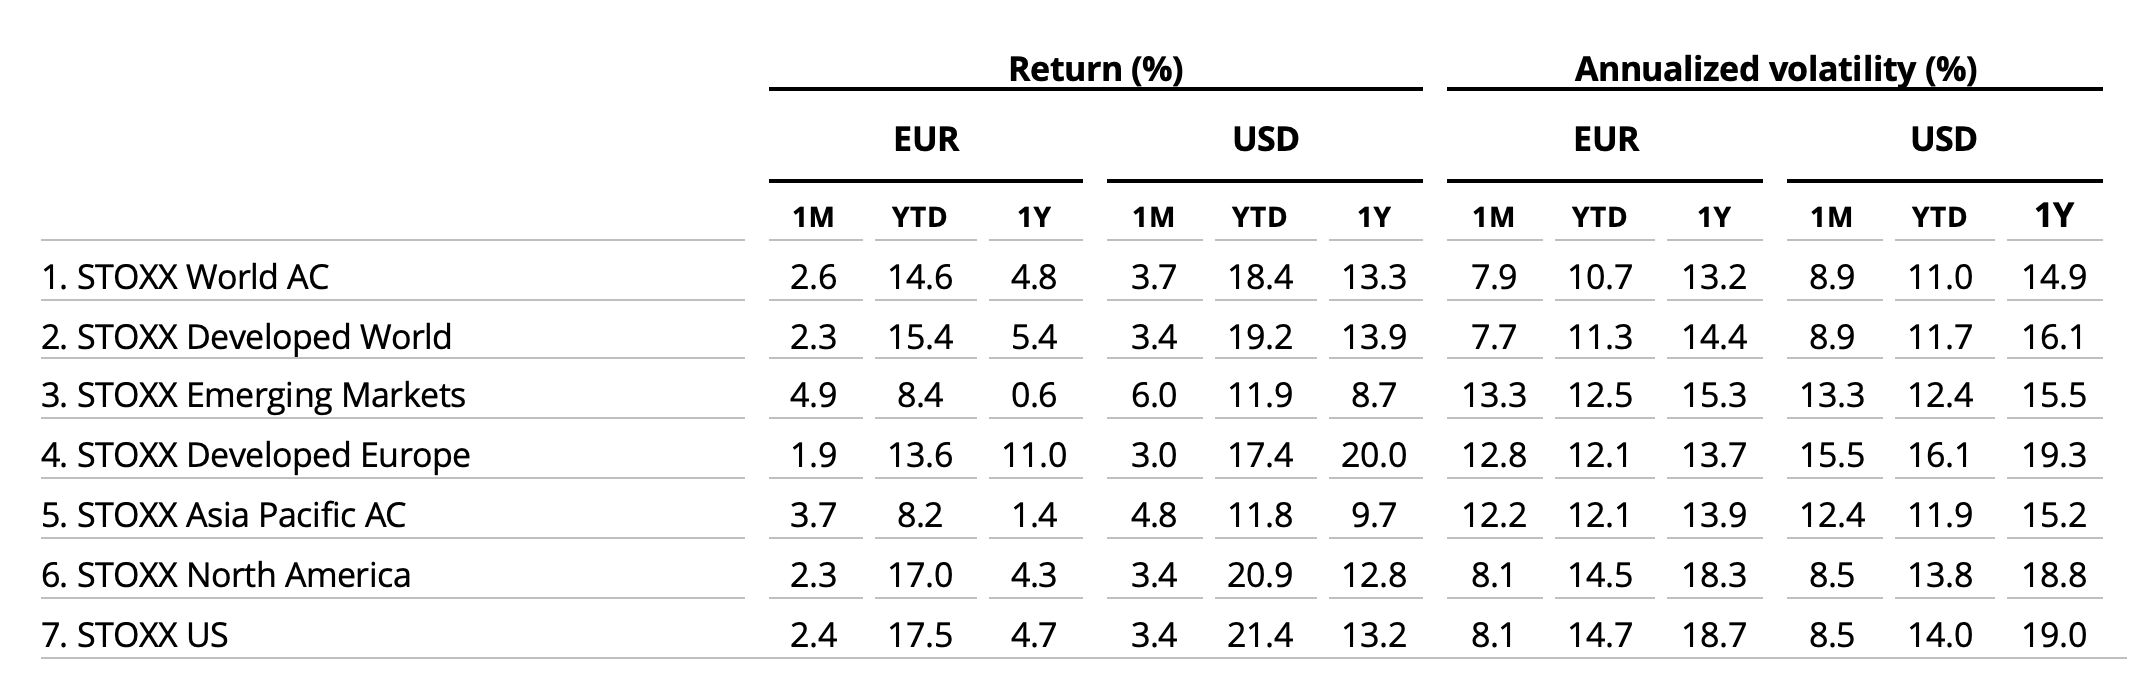
The STOXX® Global 1800 index climbed 3.3% last month when measured in dollars and including dividends,[1] taking its gain in 2023 to 18.8%. The benchmark slid 17.9% in 2022, its worst year since 2008, as central banks pressed ahead with higher rates to fight runaway inflation. The index added 2.2% in euros in July, a seventh straight monthly gain, after the greenback fell against the common currency. The STOXX® World AC index added 3.7% in dollars.
The Eurozone’s EURO STOXX 50® gained 1.8% in euros in July on a total-return basis, while the pan-European STOXX® Europe 600 rose 2.2%,[2] both reaching a record high. When excluding dividends, or price basis, the STOXX Europe 600 is still 4.4% short of the all-time high in January 2022, and the EURO STOXX 50 is 11% lower than its record in March 2000.The STOXX® North America 600 climbed 3.2% in dollars, as did the STOXX® USA 500. The STOXX®Asia/Pacific 600 advanced 3.7% in dollars. The STOXX® Developed World rose 3.4% and the STOXX® Emerging Markets gained 6%.
Figure 1: STOXX Benchmark indices’ July risk and return
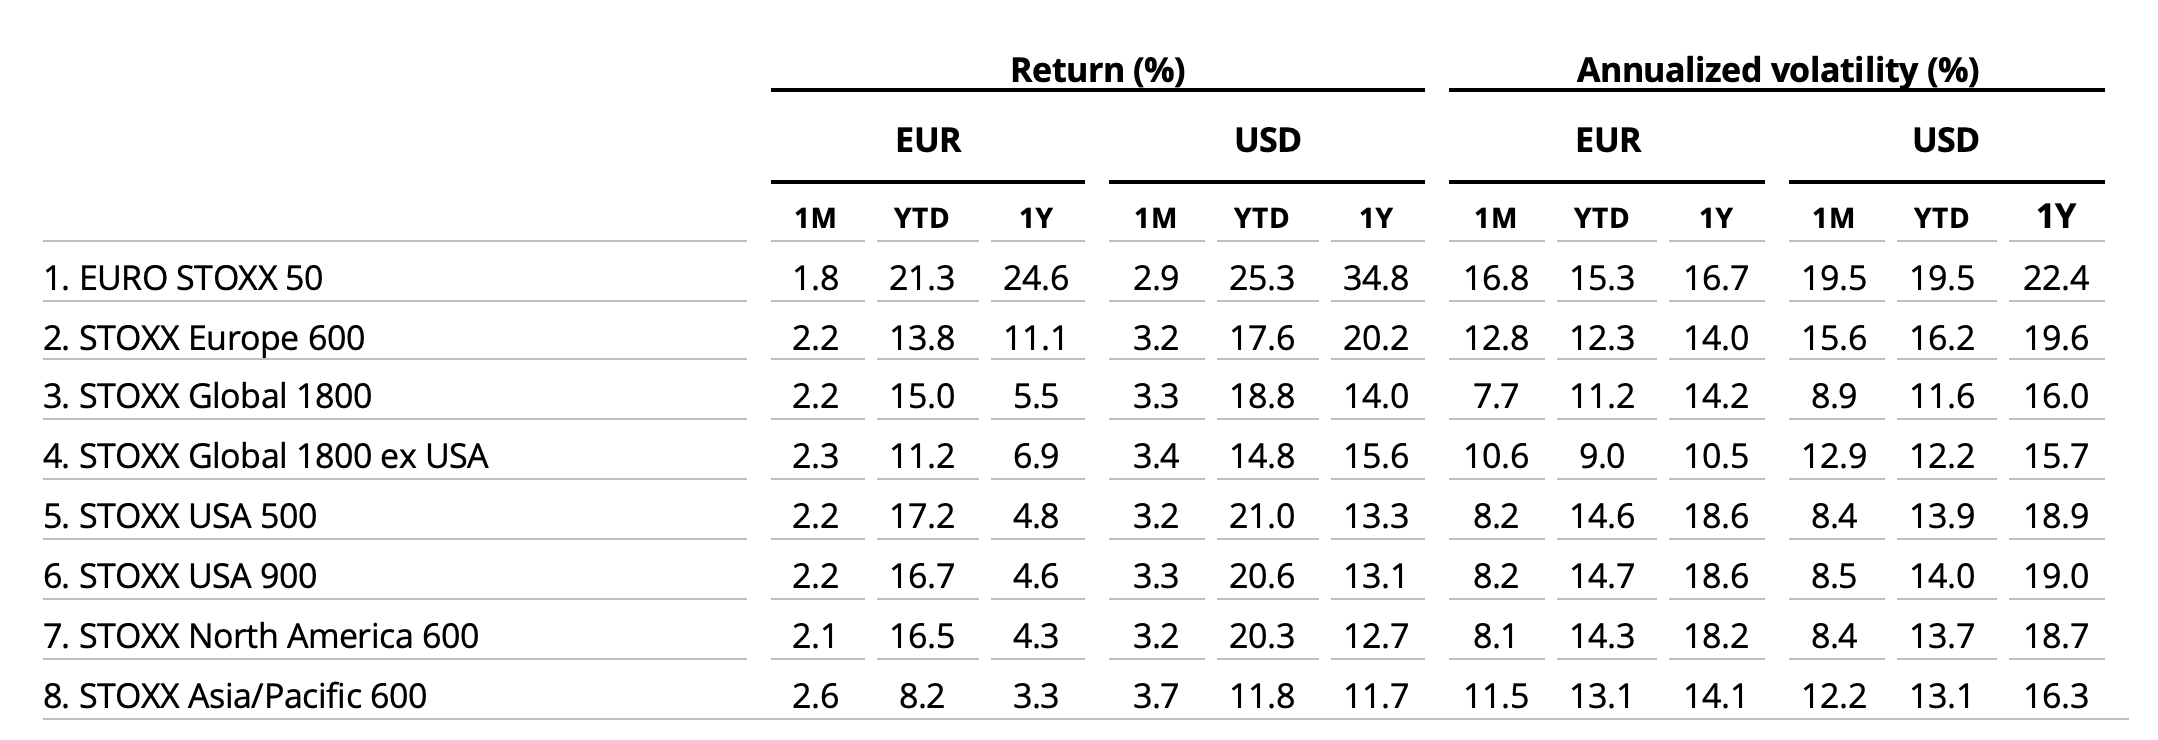
Figure 2: STOXX Equity World indices’ July risk and return
Germany’s DAX® gained 1.9% in the month. MDAX®, which gauges the performance of German mid-caps, climbed 4.4%.
| For a complete review of all indices’ performance last month, visit our July index newsletter |
‘Soft landing’
US consumer prices rose 3% in June from a year earlier, the lowest annual rate in more than two years and less than economists had expected. At the end of last month, the US Commerce Department reported that the country’s gross domestic product expanded at a 2.4% annualized pace in the second quarter, topping a 2% forecast from economists. While the Federal Reserve in July hiked the key interest rate by 25 basis points to a 22-year high, reports suggest that the central bank is controlling inflation while managing a “soft landing” of the economy.
Company reports are also adding to the bullish sentiment. According to FactSet, 80% of US companies that have released second-quarter earnings have beaten estimates.[3] The ratio is higher than the 5-year average of 77% and the 10-year average of 73%.
Figure 3: Total annual % returns for STOXX World AC index
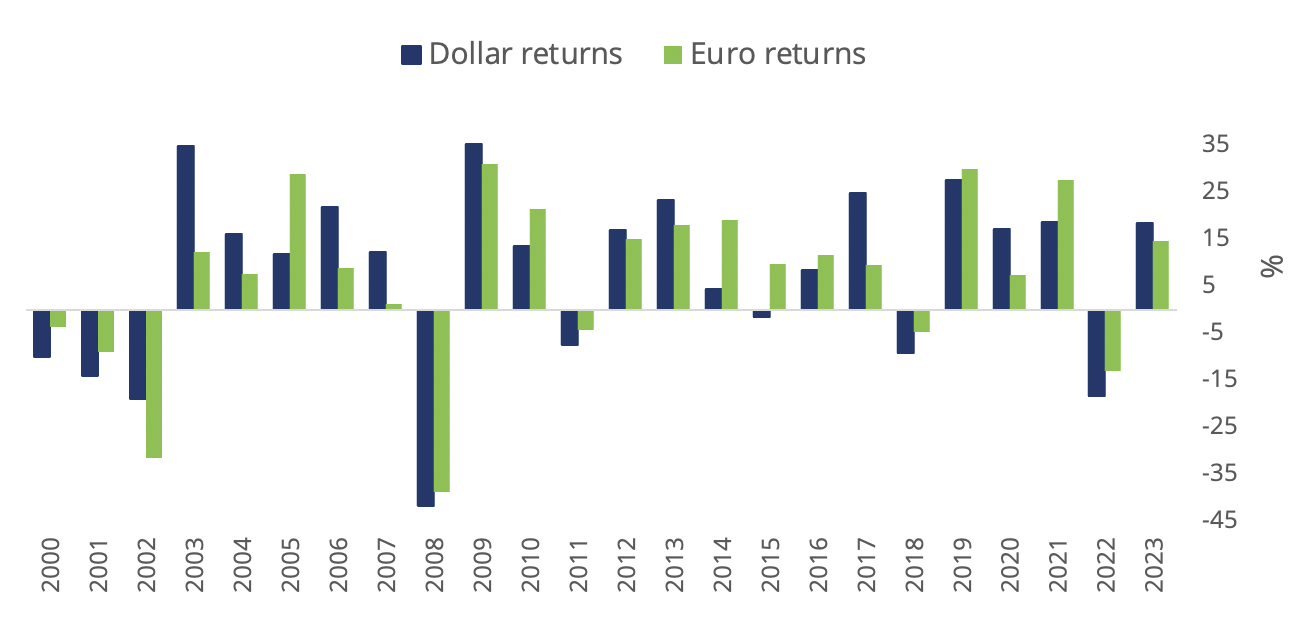
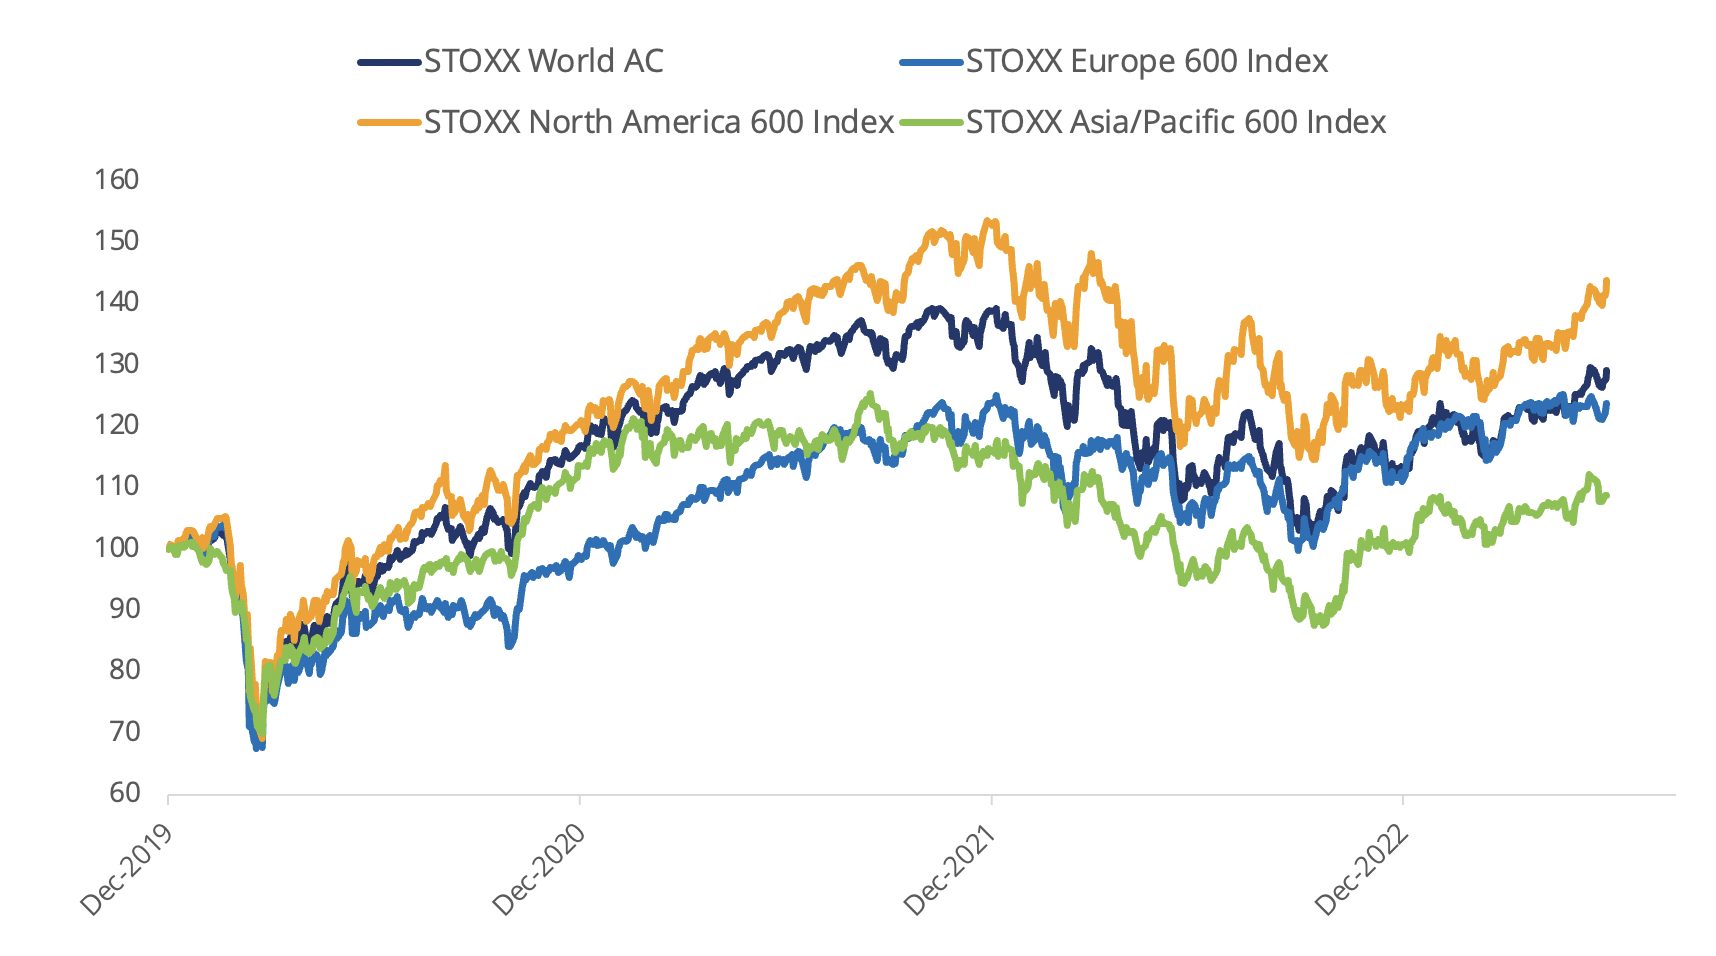
Figure 4: Select STOXX benchmarks’ returns since Jan. 1, 2020
Volatility edges up
Despite the gains in stocks, the EURO STOXX 50® Volatility (VSTOXX®), which tracks EURO STOXX 50 options prices, rose to 16.2 at the end of last month from 13.6 in June. A higher VSTOXX reading suggests investors are paying up for puts that offer insurance against stock price drops. The VDAX-New®, which measures volatility in German equities, climbed to 15.6 from 13.5 in June.
Banks lead gains
All 20 Supersectors in the STOXX Global 1800 had positive returns in July, led by an 8.1% jump for the STOXX® Global 1800 Banks index.
All 25 developed markets tracked by STOXX advanced in July when measured in dollars. Nineteen of 20 national developing markets tracked by STOXX rose in the month.
Factor investing
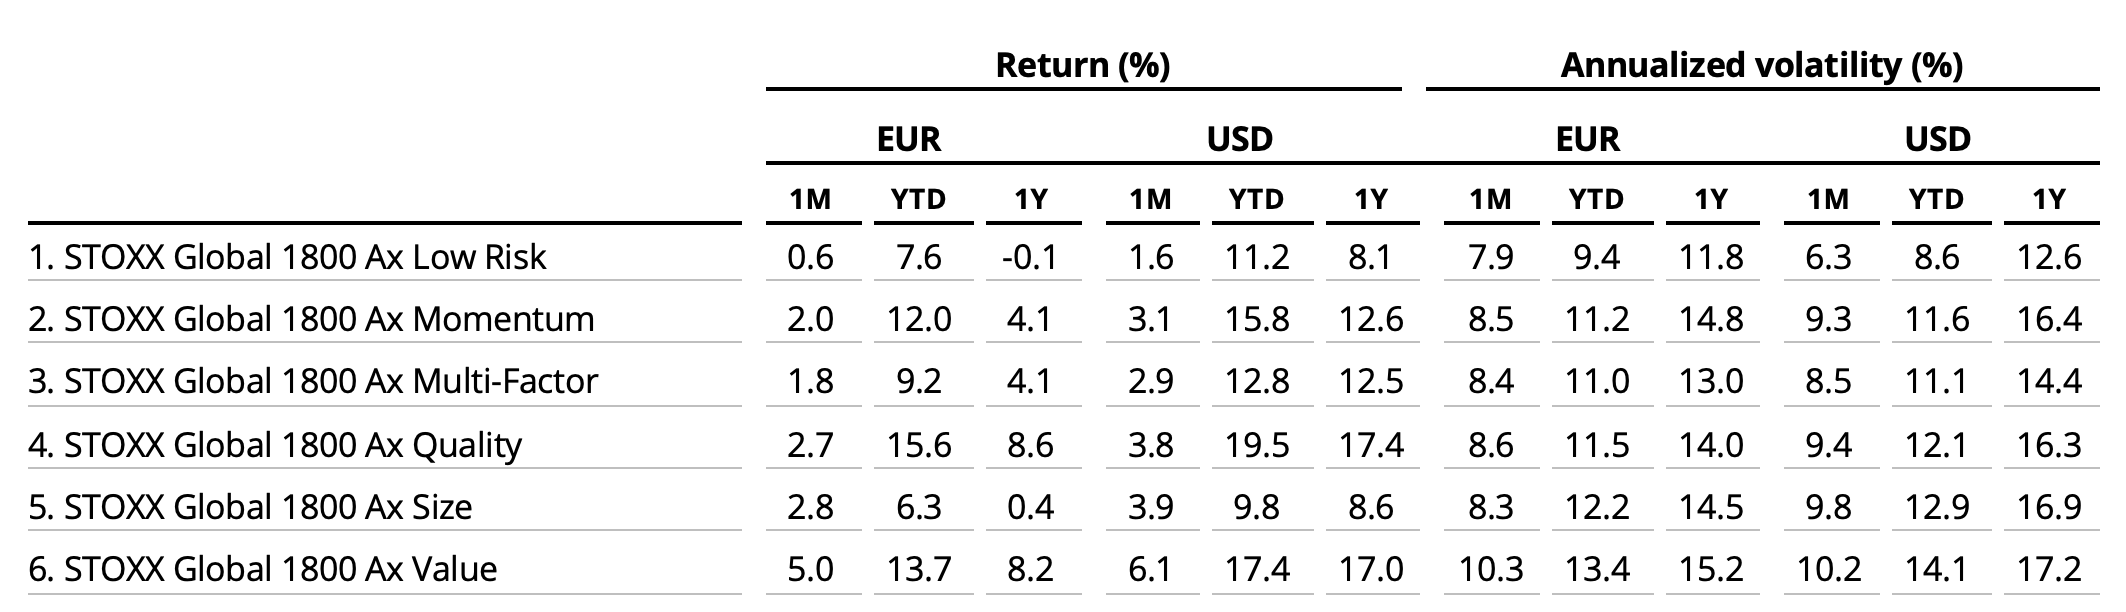
On a global basis, Value was the leading style for a second consecutive month, according to the STOXX Factor indices. Low Risk was the worst-performing style, repeating June’s position at the bottom of the ranking.
Figure 5: STOXX Factor (Global) indices’ July risk and return characteristics
Climate benchmarks
Among climate benchmarks, the STOXX® Global 1800 Paris-Aligned Benchmark (PAB) (+2.7%)[4] and the STOXX® Global 1800 Climate Transition Benchmark (CTB) (+2.7%) underperformed their benchmark in the month. The PAB and CTB indices follow the requirements outlined by the European Commission’s climate benchmarks regulation.
The STOXX® Willis Towers Watson World Climate Transition Index added 3.1%. The STOXX Willis Towers Watson Climate Transition Indices (CTIs) employ a unique Climate Transition Value at Risk (CTVaR) methodology that quantifies the anticipated impact of an economic transition on equity valuations. The CTIs look beyond carbon emissions and make a forward-looking, bottom-up evaluation of asset repricing risks in a decarbonization pathway.
Among the STOXX Low Carbon indices, the EURO STOXX 50® Low Carbon (+1.8%) performed broadly in line with the EURO STOXX 50 in July. Elsewhere, the STOXX® Global Climate Change Leaders (+2.7%), which selects corporate leaders that are publicly committed to reducing their carbon footprint, underperformed the STOXX Global 1800 by 60 basis points last month.
Sustainability indices
The STOXX® Global 1800 ESG-X index added 3.3% in the month. The STOXX® ESG-X indices are versions of traditional, market-capitalization-weighted benchmarks that observe standard responsible exclusions.
Within indices that combine exclusions and ESG best-in-class integration, the EURO STOXX 50® ESG index added 1.6% in July. Germany’s DAX® 50 ESG index (+2.6%), which excludes companies involved in controversial activities and integrates ESG scoring into stock selection, outperformed the benchmark DAX.
Among other STOXX sustainability families, the STOXX® Global 1800 ESG Broad Market rose 3.2% in the month. The STOXX ESG Broad Market indices apply a set of compliance, product involvement and ESG performance exclusionary screens on a starting benchmark universe until only the 80% top ESG-rated constituents remain.
The STOXX® Global 1800 ESG Target rose 3.4%, the EURO STOXX® ESG Target advanced 1.6% and the DAX® ESG Target added 2%. The STOXX and DAX ESG Target indices seek to significantly improve the benchmark portfolio’s ESG profile while mirroring its returns as closely as possible. Through a series of constraints, the indices implement an optimization process to maximize the overall ESG score of the portfolio while limiting the tracking error to the benchmark.
The STOXX® Global 1800 SRI climbed 3.1%. The STOXX SRI indices apply a rigorous set of carbon emission intensity, compliance and involvement screens, and track the best ESG performers in each industry group within a selection of STOXX benchmarks.
Finally, the DAX® ESG Screened climbed 2.3% in the month. The index reflects the composition of the DAX benchmark minus companies that fail to pass norms-based and controversial weapons screenings, meet minimum ESG ratings or are involved in certain business activities considered undesirable from a responsible investing perspective.
Thematic indices: Copper Miners in focus
Among 31 STOXX® Thematic indices, 18 outperformed the benchmark STOXX Global 1800 last month. The STOXX® Global Copper Miners (+12.1%) was the best-performing index for a second straight month.
Dividend strategies
Most dividend strategies outperformed last month. The STOXX® Global Maximum Dividend 40 (+4.5%) selects only the highest-dividend-yielding stocks. The STOXX® Global Select Dividend 100 (+6.5%) tracks companies with sizeable dividends but also applies a quality filter such as a history of stable payments.
Minimum variance
Minimum variance strategies struggled as investors avoided low-risk shares. The STOXX® Global 1800 Minimum Variance rose 1.2% and the STOXX® Global 1800 Minimum Variance Unconstrained added only 0.8%.
The STOXX Minimum Variance Indices come in two versions. A constrained version has similar exposure to its market-capitalization-weighted benchmark but with lower risk. The unconstrained version, on the other hand, has more freedom to fulfill its minimum variance mandate within the same universe of stocks.
[1] All results are total returns before taxes unless specified.
[2] Throughout the article, all European indices are quoted in euros, while global, North America, US, Japan and Asia/Pacific indices are in dollars.
[3] FactSet, ‘Earnings Insight,’ July 28, 2023.
[4] Figures in parentheses show last month’s gross returns.


