

Stocks rebounded in March from two months of losses, helped by expectations of a resolution to the war in Ukraine. Basic-resources and energy companies paced gains for a second consecutive month.
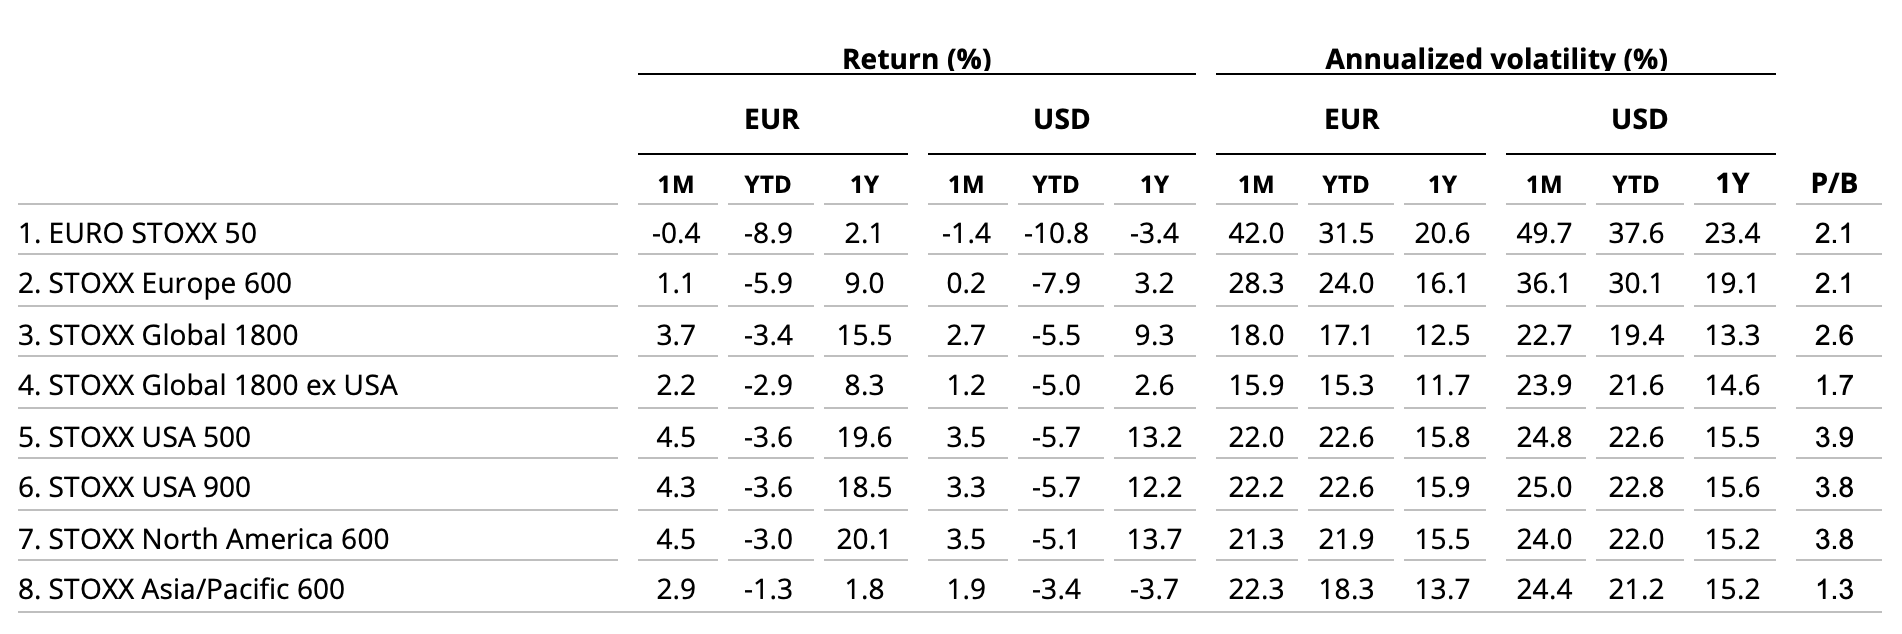
The STOXX® Global 1800 index rose 2.7% when measured in dollars and including dividends.1 The benchmark jumped 3.7% in euros.
The pan-European STOXX® Europe 600 added 1.1% in euros, while the Eurozone’s EURO STOXX 50® decreased 0.4%.2 The STOXX® North America 600 rose 3.5% in dollars as did the STOXX® USA 500. The STOXX® Asia/Pacific 600 added 1.9%.
Figure 1: Benchmark indices’ March risk and return characteristics
Russia’s announcement last month that it was refocusing its intervention of Ukraine on the eastern part of the country rather than a full occupation raised optimism that the conflict may de-escalate. Investors returned to buying after two months of selling left the STOXX Global 1800 index trading more than 10% below its January high.
| For a complete review of all indices’ performance last month, visit our March index newsletter. |
The STOXX Global 1800 posted in 2021 its third consecutive double-digit annual advance and has now gained in nine of the past ten years. Returns have amounted to an average of 13.9% per year over the last decade.
Figure 2: Annual % returns for STOXX Global 1800 index
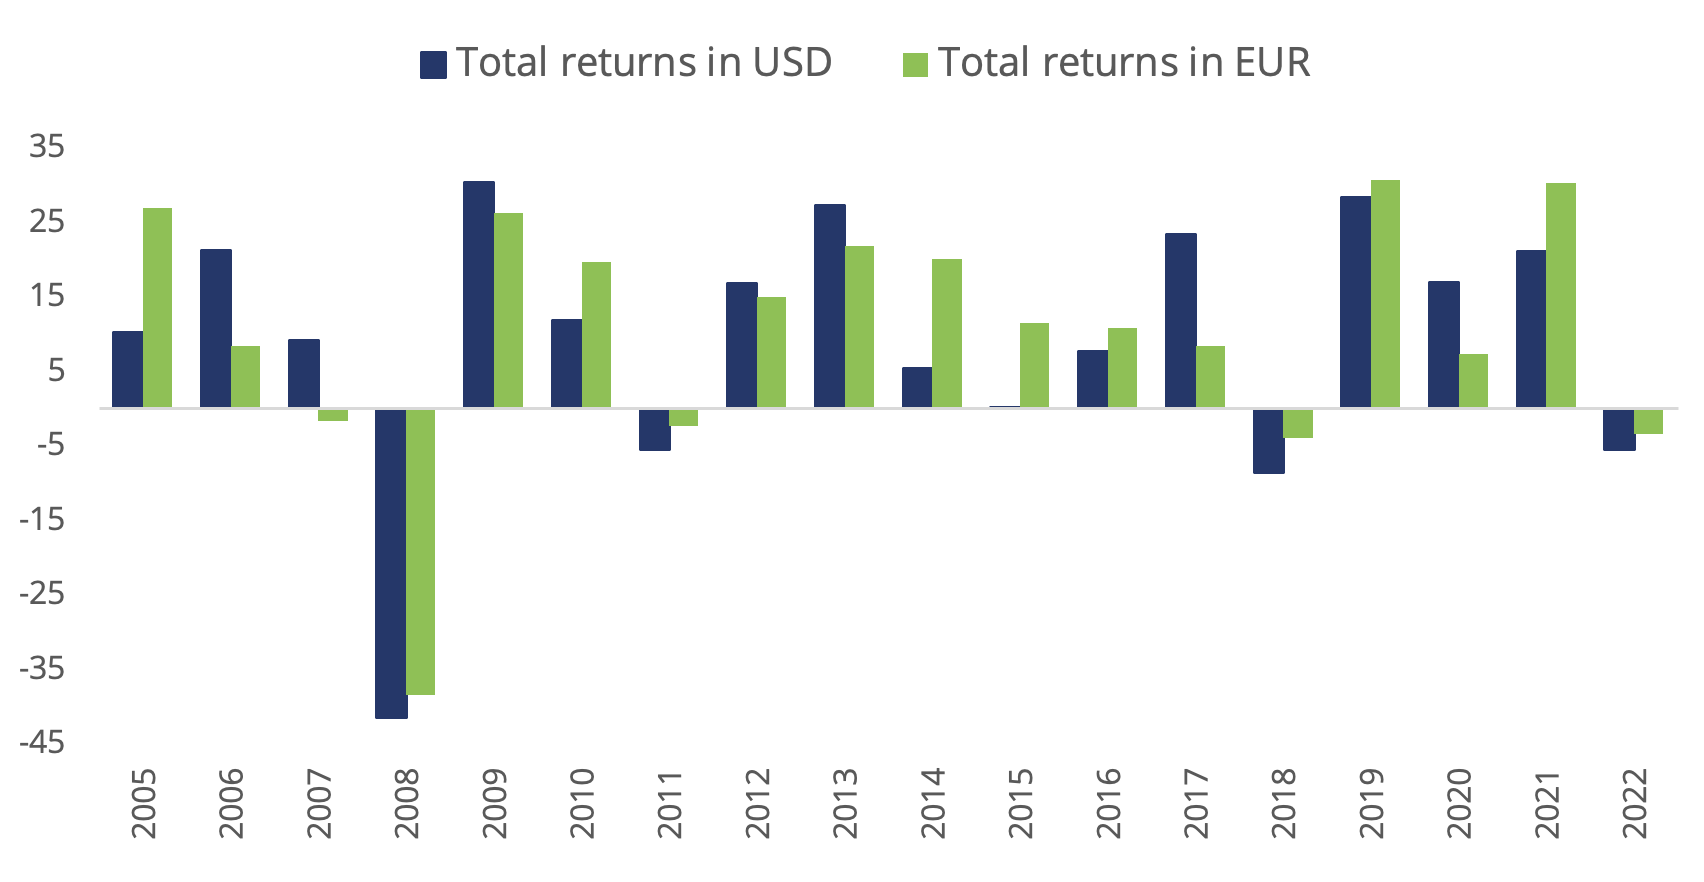
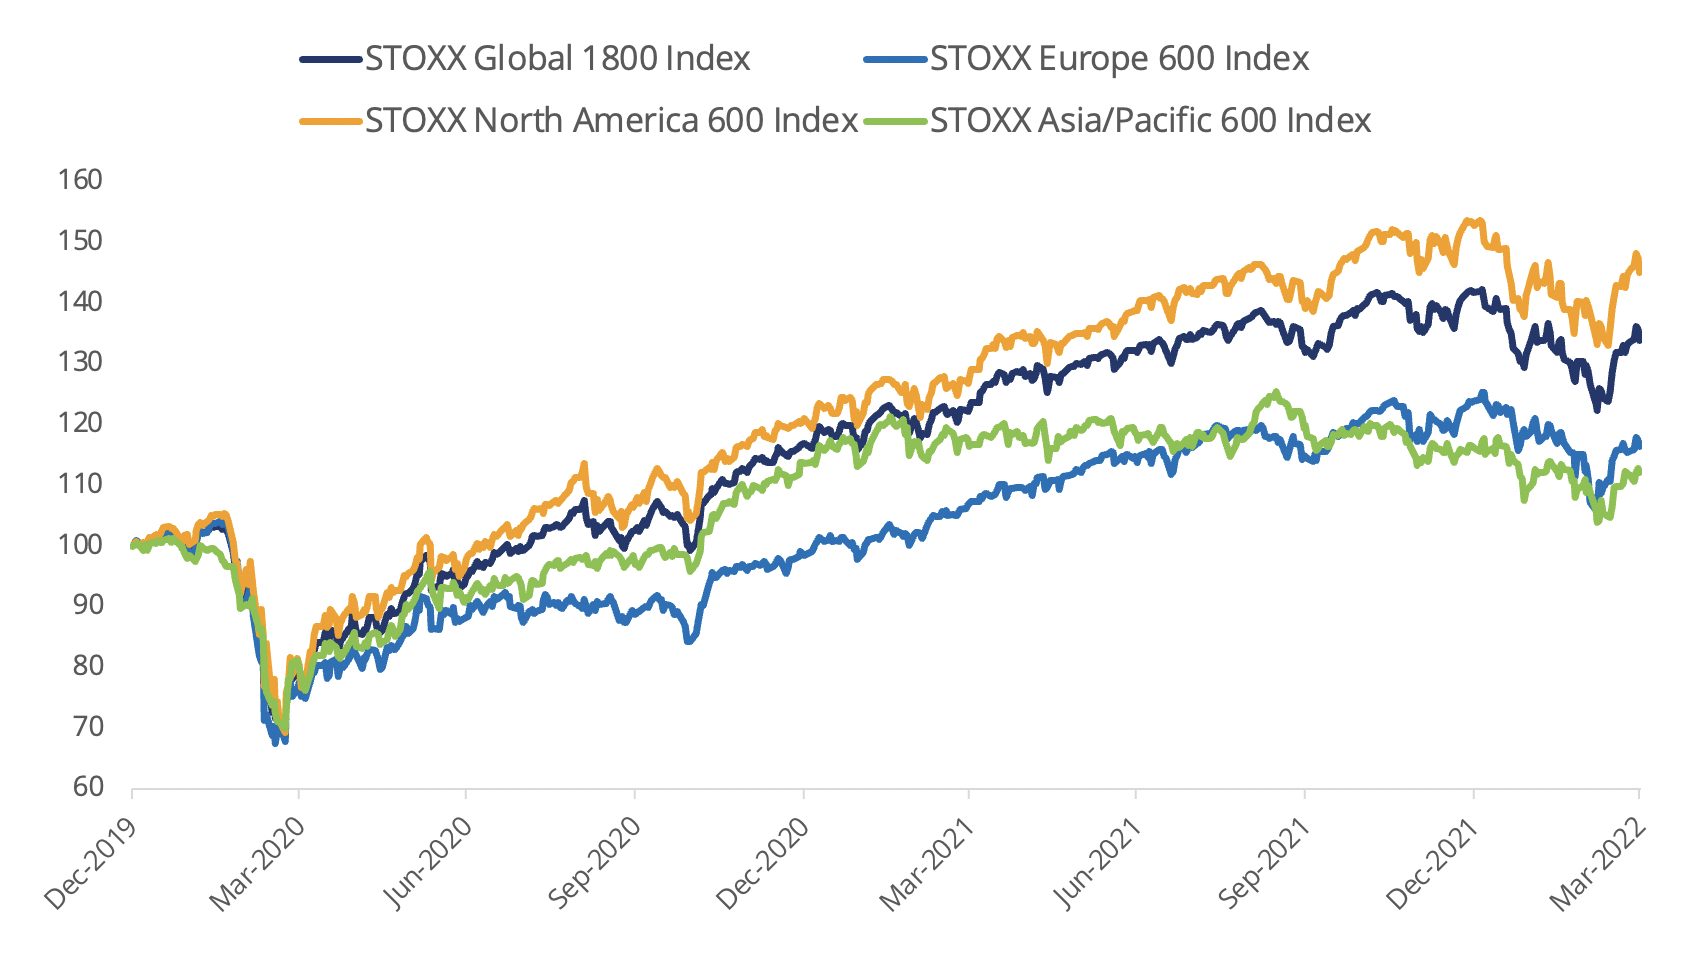
Figure 3: Returns since January 1, 2020
Volatility eases
The EURO STOXX 50® Volatility (VSTOXX®), which tracks EURO STOXX 50 options prices, fell to 29 at the end of last month from 35.3 in February. A higher VSTOXX reading suggests investors are paying up for puts that offer insurance against stock price drops. The index climbed to 86 in March 2020 as governments restricted work and social activities.
The VDAX-New®, which tracks volatility in German equities, dropped to 29.3 from 34.2 in February.
Developed and emerging markets
Fifteen of 25 developed markets tracked by STOXX advanced during March when measured in dollars. The STOXX® Developed Markets 2400 index rose 2.6% in dollars and 3.6% in euros.
Fourteen of 21 national developing markets rose in the month on a dollar basis. The STOXX® Emerging Markets 1500 index declined 0.6% in the US currency and gained 0.3% in euros.
Basic-resources, energy shares jump again
Fourteen of 20 Supersectors in the STOXX Global 1800 gained in the month. The STOXX® Global 1800 Basic Resources added 10.5% and was the top performer for a second straight month. The STOXX® Global 1800 Energy came in second again with a 7.5% advance, extending this year’s jump to 29%. At the other end, the STOXX® Global 1800 Media (-3.5%)3 yielded the worst return.
Factor investing
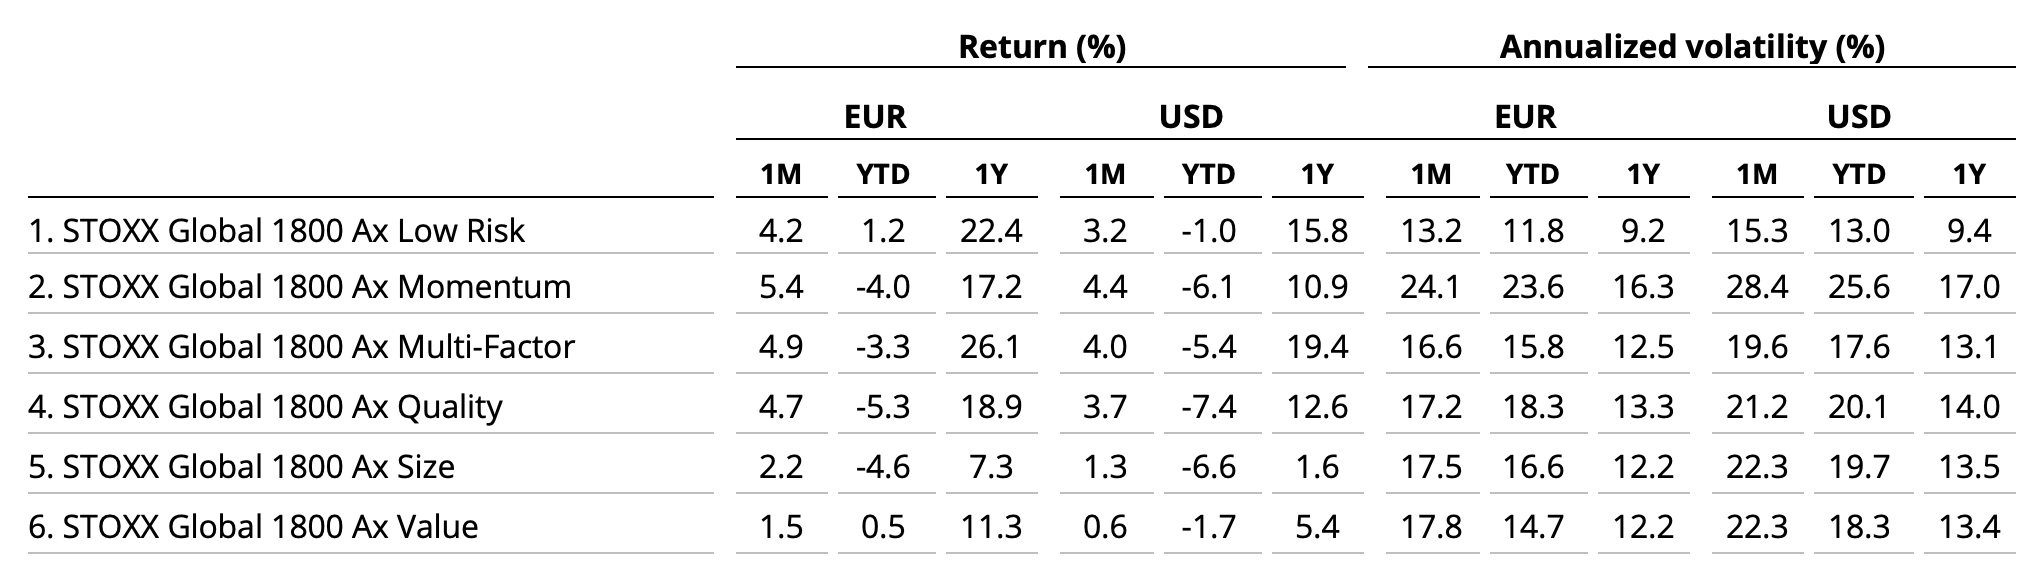
All factor strategies covering global markets beat the STOXX Global 1800 benchmark, except for Size and Value, according to the STOXX Factor indices. The STOXX® Global 1800 Ax Momentum showed the best performance during the month.
Figure 4: STOXX Factor (Global) indices’ March risk and return characteristics
Climate benchmarks
The STOXX Paris-Aligned Benchmark indices (PABs) and STOXX Climate Transition Benchmark indices (CTBs) indices outperformed last month. The STOXX® Global 1800 PAB index rose 2.8% and the STOXX® Global 1800 CTB index gained 3%. The PAB and CTB indices follow the requirements outlined by the European Commission’s climate benchmarks regulation.
The STOXX® Willis Towers Watson World Climate Transition Index added 2.6% in March. The STOXX Willis Towers Watson Climate Transition Indices (CTIs) were introduced in October 2021. They employ a unique Climate Transition Value at Risk (CTVaR) methodology that quantifies the anticipated impact of an economic transition on equity valuations. The CTIs look beyond carbon emissions and make a forward-looking, bottom-up evaluation of asset repricing risks in a decarbonization pathway.
Among the STOXX Low Carbon indices, the EURO STOXX 50® Low Carbon (-1%) trailed the EURO STOXX 50 by 52 basis points in March. Elsewhere, the STOXX® Global Climate Change Leaders (0.7%), which selects corporate leaders that are publicly committed to reducing their carbon footprint, underperformed the STOXX Global 1800 index by nearly 2 percentage points.
ESG-X and ESG indices
The STOXX® Global 1800 ESG-X index rose 2.8%. The STOXX® ESG-X indices are versions of traditional, market-capitalization-weighted benchmarks that observe standard responsible exclusions of leading asset owners.
Within indices that combine exclusions and ESG best-in-class integration, the EURO STOXX 50® ESG index (0.2%) outperformed its benchmark by 68 basis points during March. Germany’s DAX® 50 ESG index (-0.2%), which excludes companies involved in controversial activities and integrates ESG scoring into stock selection, slightly outperformed the benchmark DAX® (-0.3%).
Sustainability indices
Among other STOXX sustainability families, the STOXX® Global 1800 ESG Broad Market index climbed 2.9% in the month. The STOXX ESG Broad Market indices apply a set of compliance, product involvement and ESG performance exclusionary screens on a starting benchmark universe until only the 80% top ESG-rated constituents remain.
Next, the STOXX® Global 1800 ESG Target gained 2.2%, the EURO STOXX® ESG Target fell 0.1% and the DAX® ESG Target dropped 0.2%. The STOXX and DAX ESG Target indices seek to significantly improve the benchmark portfolio’s ESG profile while mirroring its returns as closely as possible. The indices implement, through a series of constraints, an optimization process to maximize the overall ESG score of the portfolio while constraining the tracking error to the benchmark.
Finally, the STOXX® Global 1800 SRI rose 2.7%, in line with its benchmark. The STOXX SRI indices apply a rigorous set of carbon emission intensity, compliance and involvement screens, and track the best ESG performers in each industry group within a selection of STOXX benchmarks.
Thematic indices
There were poor performances relative to the benchmark from the STOXX® Thematic indices in the month that ended, with only five of 22 revenue-based thematic indices outperforming the STOXX Global 1800. The iSTOXX® Developed Markets B.R.AI.N. led gains with a 5.1% jump, followed closely by the STOXX® Global Smart Cities.
The STOXX Thematic indices seek exposure to the economic upside of disruptive global megatrends and follow two approaches: revenue-based (22 indices) and artificial-intelligence-driven (three indices).
Among the STOXX artificial-intelligence-driven thematic indices, the STOXX® AI Global Artificial Intelligence index (0.3%) and its ADTV5 version (0.4%) underperformed the STOXX Global 1800 index during March, as did the iSTOXX® Yewno Developed Markets Blockchain index (0.5%).
Dividend strategies
Dividend strategies also trailed benchmarks last month. The STOXX® Global Maximum Dividend 40 (0.8%) selects only the highest-dividend-yielding stocks. The STOXX® Global Select Dividend 100 (1.7%), meanwhile, tracks companies with sizeable dividends but also applies a quality filter such as a history of stable payments.
Minimum variance
Most Minimum variance strategies, on the other hand, outperformed. The STOXX® Global 1800 Minimum Variance added 4% and the STOXX® Global 1800 Minimum Variance Unconstrained rose 2.2%. The STOXX® Europe 600 Minimum Variance index advanced 2.3%, while its unconstrained version gained 1.5%.
The STOXX Minimum Variance Indices come in two versions. A constrained version has similar exposure to its market-capitalization-weighted benchmark but with lower risk. The unconstrained version, on the other hand, has more freedom to fulfill its minimum variance mandate within the same universe of stocks.
1 All results are total returns before taxes unless specified.
2 Throughout the article, all European indices are quoted in euros, while global, North America, US, Japan and Asia/Pacific indices are in dollars.
3 Figures in parentheses show last month’s gross returns.


