

With asset owners, companies and regulators worldwide increasing efforts to reach global climate targets, the transition to low-carbon portfolios is gathering pace.
Qontigo’s latest whitepaper1 analyzes in which region a systematic decarbonization investment process can have the highest climate-reduction impact. One surprising finding of the study is that a US climate-aware portfolio has a lower carbon footprint than a European one — a result of the disconnect between traditional weightings in the equity market and its underlying economy.
Paris-aligned benchmarks: US vs. Europe
The study, by Melissa R. Brown, Qontigo’s Global Head of Applied Research, used two regional STOXX Paris-Aligned Benchmark (PAB) indices, derived respectively from the STOXX® Europe 600 Index and the STOXX® USA 500 Index.
Qontigo introduced the PAB indices last July, to meet — and exceed — the requirements in the new European Union Climate Benchmarks regulation. The PABs aim for a 60% reduction in greenhouse gas (GHG) emissions relative to the starting universe, and an additional 7% year-on-year reduction is required after the first year.
Different profiles
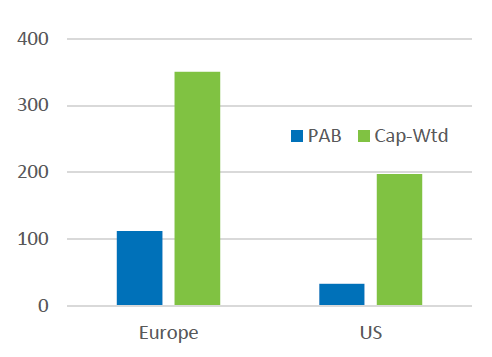
The US starting benchmark is already less carbon-intensive than the European one (Figure 1).
“This was a counterintuitive observation given the fact that the US economy is itself more carbon-intensive,” said Brown. “Also, climate action has been a focus of European regulators, companies and investors for longer whereas US-based investors have been mainly concerned about the potential give-up in returns. Alas, our initial expectation was wrong!”
Figure 1: GHG intensity
As Brown states, this is a result of the composition of the STOXX USA 500 Index. A detailed analysis of a portfolio of mid-sized stocks outside the US benchmark2 shows a different carbon picture.
GHG intensity is concentrated in a few sectors
Sector composition is naturally a key element in the carbon footprint and decarbonization process of the PAB portfolios. The highly polluting Energy3 sector contributes by far the highest proportion of GHG intensity to both regional parent indices, the study finds. However, Energy and Utilities — the biggest emissions sinners — are more heavily weighted in the European benchmark. Yet, the major GHG contribution difference is in the Materials sector (another high-carbon intensity industry), which is both larger and ‘dirtier’ in Europe.
On the flip side, the ‘greener’ Information Technology sector accounts for more than a third of the STOXX USA 500 benchmark but has a significantly lower weight in Europe.
Active risk is low, but its distribution differs from region to region
The whitepaper also looks at what active risk investors take on in the decarbonization process — a way to gauge the cost of transitioning to a low-carbon portfolio.
As of Mar. 23, 2021 (the most recent index rebalance), the STOXX USA 500 and the STOXX Europe 600 PABs had a tracking error of just over 2% versus their benchmarks (Figure 2, left chart).
Figure 2: Total and active risk, and percent of active risk
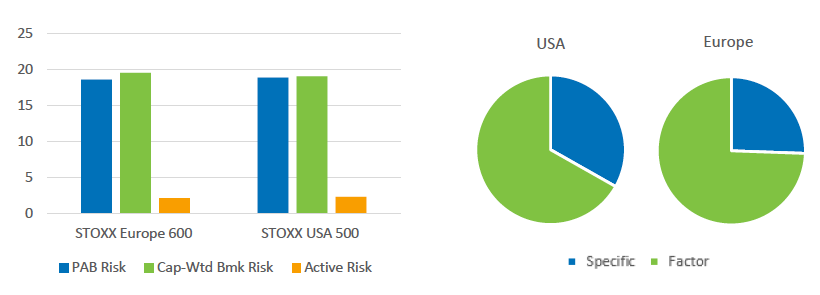
Whilst the top-line risk profile of the two indices is similar, differences emerge once the risk components are pulled apart.
Europe contains lower-beta names
More of Europe’s active risk came from factors, whereas the US PAB had slightly more stock-specific active risk (Figure 2, right chart). In the US, both overweights and underweights contributed to the active risk, the study shows. By contrast, in Europe the risk was all in the underweights, and the overweight bets were diversifying.
Zooming in on the active risk, the analysis found that 33% of the factor risk in Europe came from style exposure, with the negative tilt to Market Sensitivity representing two thirds of it. Overall, almost 22% of the factor risk in the US was style-based. Here, active style bets were more diversified, albeit the exposure to Growth stood out.
Zero-weight energy is biggest risk contributor
On the other hand, active industry risk was higher in the US than in Europe, accounting for 45% of the total active risk. The zero weight in Energy was the biggest contributor, far ahead of the risk coming from all other industry bets. In Europe, where industry risk was around 37% of the total, the complete absence of Energy stocks was also the biggest contributor to risk, but risk from the overweights in Pharmaceuticals and Household & Personal Products was not far behind.
“Overall, we found the active risk of both PABs to be relatively low — certainly no higher than many actively-managed portfolios, and with the possible exception of the underweights in Oil, Gas and Consumable Fuels, no individual element stood out as a driver of risk that might be concerning,” Brown writes. “The goal of investing in a broadly diversified benchmark that meets the Paris standards can easily be achieved.”
A higher decarbonization hurdle every year
The Paris-Aligned Benchmark methodology enables investors a transparent and rules-based strategy to align their portfolios with science-based decarbonization goals and invest in those companies leading in emissions-reduction efforts.
While adopting a PAB strategy significantly lowered the carbon footprint of both the European and the US portfolios, it was the latter that showed the biggest relative reduction as of March. In other words, investors in the US index achieved a higher sustainability impact with their dollars than did their European counterparts. Yet, as Brown writes, this edge may ebb in coming years as the 7% annual decarbonization objective embedded in the PAB indices becomes harder to attain.
“Still, we remain firmly convinced that the Paris-Aligned Benchmark methodology offers companies substantial incentives to reduce emissions and be included in the benchmark,” Brown writes. “As more and more investors shift their investments into these kinds of strategies, this will be a win-win — not only for the environment, of course, but also for investors who will be able to invest in a well-diversified, broad-market benchmark.”
This new study may be of special interest for investors in the process of transitioning to a low-carbon strategy. You can access the whitepaper here for a complete risk analysis of the STOXX PAB indices.
1 Melissa R. Brown, ‘The Best Bang for Your Climate-Aware Buck (Or Pound, Euro, Yen – You Name It),’ Qontigo, June 2021.
2 The report in particular analyzes the carbon exposure of the 400 stocks that are part of the broader STOXX® USA 900 Index but not of the STOXX USA 500.
3 Sector name is Oil, Gas and Consumable Fuels.


