

Tracking error (TE) — the all-important statistic that serves as a measure of portfolio risk — is gaining even more prominence in the investment world these days with the growth of sustainable strategies.
While the pursuit of environmental, social or governance (ESG) objectives can exist outside the traditional risk/return matrix, in reality, returns and risk cannot simply be ignored. This notion is a key reason why many sustainable strategies are tracking error-aware.
With this in mind, a new article[1] from Hamish Seegopaul, Global Head for Index Product Innovation at Qontigo, seeks to revisit the concept of tracking error, and explore what the metric really means and how it can be embedded in the portfolio construction process.
Necessary trade-offs
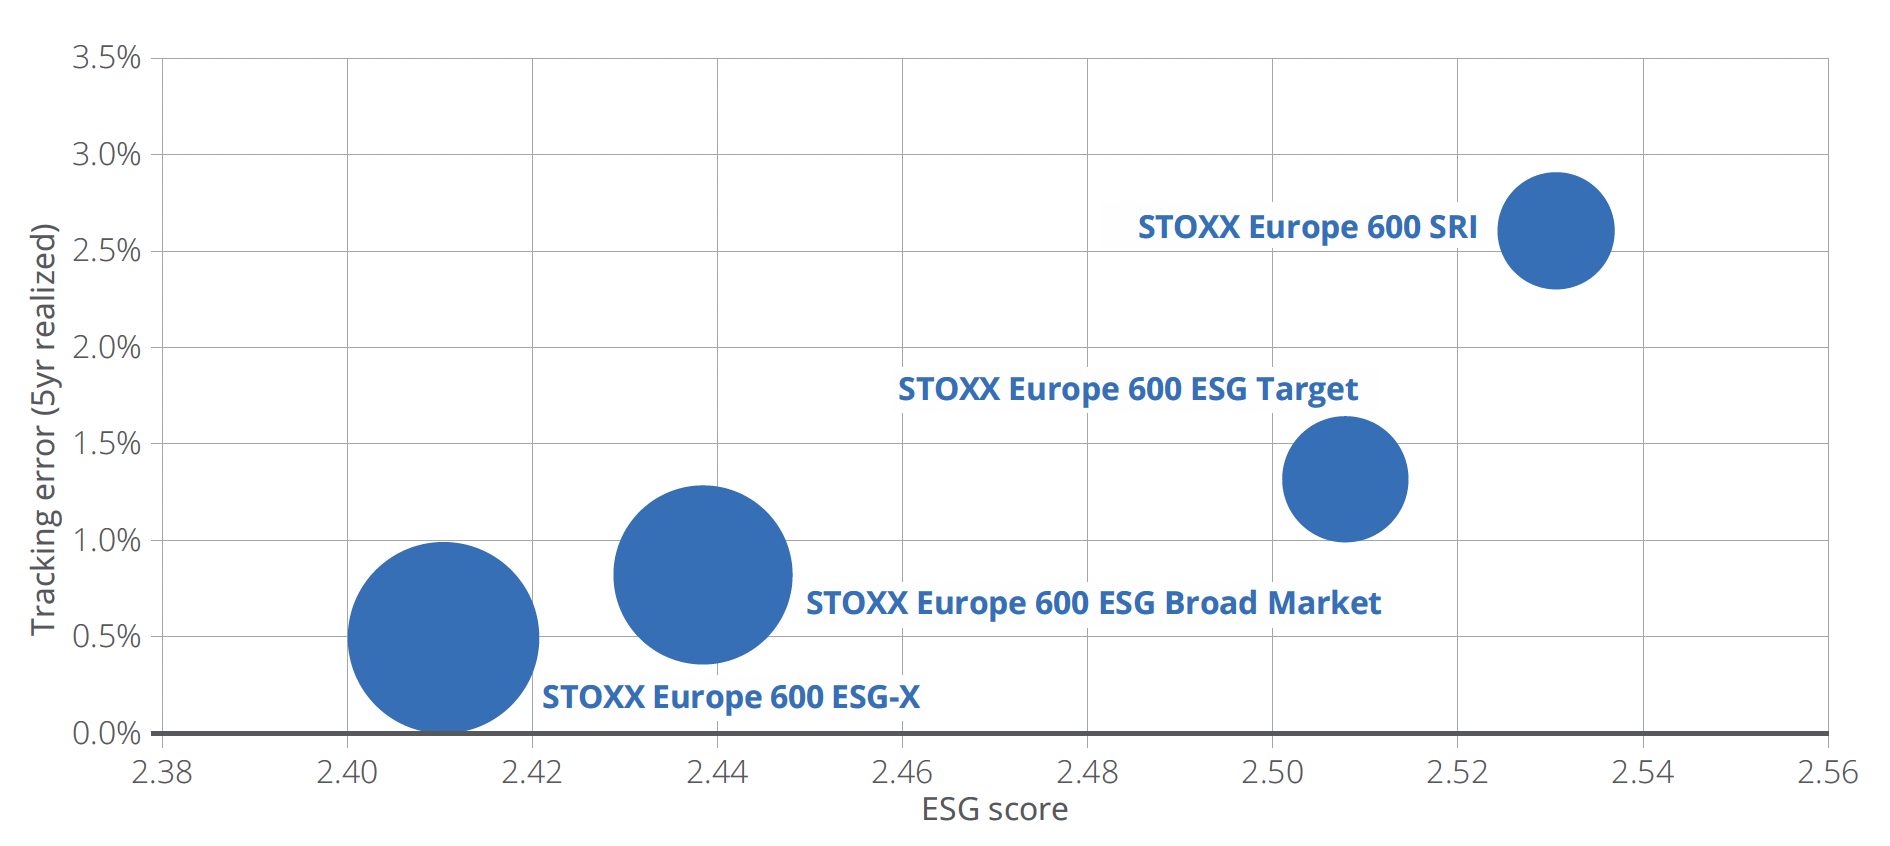
Looking at several key STOXX ESG indices, a trend and its intuition are clear: as the ESG score of a sustainable portfolio rises, the investment manager implements a bigger deviation in weights vs. the benchmark, and takes on a higher tracking error, in order to achieve their overarching objective. Figure 1 shows this pattern in the form of ESG score vs. realized tracking error. But how should we interpret the degree of difference in TE? What does TE tell us in terms of the future? And can we control the outcome?
Figure 1: STOXX ESG indices — ESG scores vs. tracking error.
So, what does a TE of x% really mean?
As Seegopaul writes, TE is the annualized standard deviation of the difference between the portfolio’s returns and those of its benchmark. However, there seems to be less discussion about what the results imply.
To visualize what tracking error means in practice, the author randomly generated portfolio returns over a theoretical 10-year period for differing levels of tracking error. The analysis assumed that the portfolio’s average outperformance was 0% and used a probability distribution to plot relative performances to the benchmark (i.e., the active returns). The shaded areas are made up of thin lines, each one representing a simulated portfolio performance.
Figure 2: Randomized active portfolio returns for tracking errors of 1%, 2.5%, 5% and 10%.
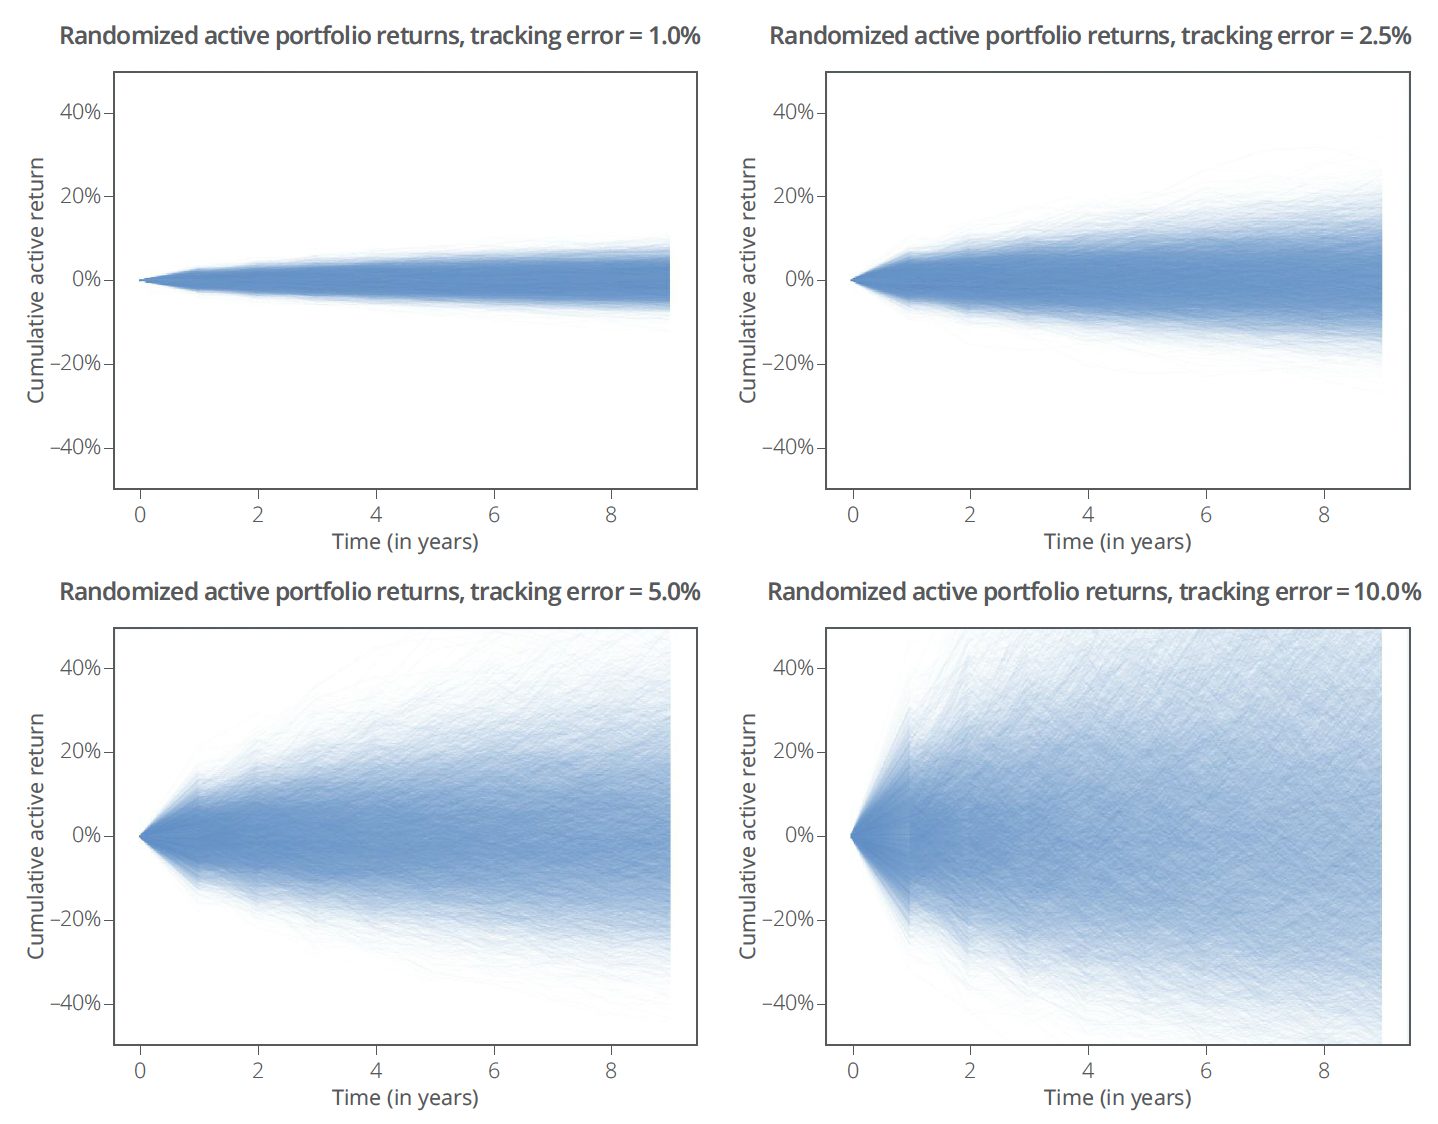
Varying the tracking error did not impact the average outperformance of all the theoretical portfolios in Figure 2 (which is still 0%). Instead, it influenced the range of potential outcomes. The idea is that tracking error should be interpreted as a probability distribution.
Tracking error figures are reported as one standard deviation moves relative to the benchmark. In other words, roughly 68% of the values for TE distribution would be +/- one standard deviation, 95% would be within two standard deviations, 99.7% would be within three standard deviations, and so on.
Using these implied probabilities, Seegopaul explains, it is also possible to look back on the theoretical probability that a specific return was exceeded. For example, a portfolio with a 1% TE had a 16% chance that the active return was greater than or equal to 1% — this is a one standard deviation move. For a 0.5% TE portfolio (which is intuitively more like the benchmark), the tracking error implies that the chance of exceeding a 1% outperformance dropped to just 2%.
“Tracking error tells us more than just the ‘closeness’ of a portfolio to its benchmark, and can guide us toward a range of possibilities,” Seegopaul writes. With this in mind, he argues that users of tracking error should not use the metric in expectation of a singular future outcome, but instead to think probabilistically.
Sign up to receive valuable insights, news, and invitations as soon as they are published.
Subscribe >Can we control the future? Using risk models
The goal of trying to control future tracking errors is not to target a specific return but rather to influence the potential distribution of future returns, Seegopaul writes. If we rely on the normal distribution as a guide, controlling tracking error theoretically limits both the potential upside and potential downside.
While reported tracking errors are often calculated using historical returns, TE can also be forecasted by calculating the active risk of a set of holdings. In this way, an investor can select a portfolio that targets a specific level of tracking error while still achieving other objectives. Two tools are key to achieving this: a risk model and an optimizer.
The former is designed to model the risk of asset returns by reducing the dimensionality and complexity of a portfolio with hundreds/thousands of assets to a smaller number of factor loadings. The ex-ante (predicted) risk of the portfolio is a combination of the portfolio weights, factor exposures and covariance matrices. Without a risk model, a portfolio of 500 securities would have over 125,000 inputs to estimate. The difference between a portfolio and its benchmark lies in the active weights, whose ex-ante risk — i.e., the active risk of the portfolio — can then be estimated.
An optimizer is a decision-making tool that can evaluate numerous options to arrive at a solution that best satisfies a given problem, such as “find the portfolio with the lowest ex-ante tracking error subject to a level of ESG improvement.”
In a very recent study, Qontigo’s Melissa Brown and Rob Stubbs showed the possibilities of employing these tools in an exclusions-only sustainable strategy. Their findings illustrate how an optimized exclusions portfolio can lower the tracking error vis-à-vis a non-optimized exclusions portfolio. As a result, this can reduce the likelihood of underperforming the benchmark as well.[2]
Directional guide
Finally, Seegopaul allows for a brief discussion on the limitations of using TE. The biggest disadvantage is that the statistic is backward-looking and assumes a specific probability distribution. Numerous conditions need to be met for tracking error to give us a sense of future performance. These are not trivial issues, and require tracking error to be used more as a directional than an absolute guide, Seegopaul argues.
Conclusion
Despite its limitations, tracking error is one of the most frequently used statistics in the investment landscape, with broad applications across portfolio management and trading. The growth of sustainable investments has led to an increased focus on the risk of underperformance and on ways to limit deviations in returns from the benchmark. In this sense, this recent Qontigo study may help as a guide or refresher on how to interpret tracking error, and how it can be embedded in optimized portfolios.
[1] Seegopaul, H., “Tracking Error 101: The Intuition Behind Measurement and Control,” May 2023.
[2] Assuming zero alpha (i.e., a mean active return of 0%) and normally distributed annual standard returns.


