

Stocks rose for a seventh straight month during August, amid ongoing optimism that the global economy continues to rebound from the COVID-induced slump and as the US Federal Reserve indicated it won’t rush to raise interest rates.
The STOXX® Global 1800 Index had a total return1 of 2.5% during the month when measured in dollars and 3% in euros, taking its advance in dollars so far this year to 17.5%. Excluding dividends, the index extended its all-time high.
The pan-European STOXX® Europe 600 Index returned 2.2% in euros in the month, also marking a seventh monthly gain and a new record high when excluding dividends.2 The Eurozone’s EURO STOXX 50® Index climbed 2.6% and still trades at its highest level since January 2008 on a price basis. The STOXX® North America 600 Index rose 2.8% in dollars, while the STOXX® Asia/Pacific 600 Index added 2.4% following losses in the previous two months.
Figure 1 – Benchmark indices’ August risk and return characteristics
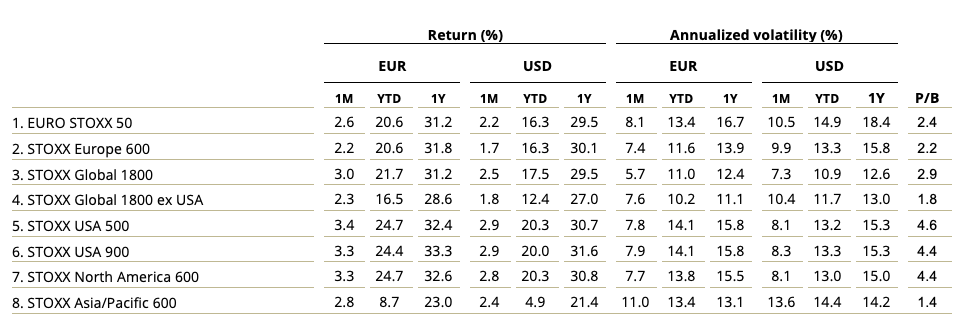
The STOXX Global 1800 rose 16.9% last year as investors raised expectations that policy support and vaccines will help economies overcome the pandemic-induced slump. The index is poised for its ninth annual advance in the past ten years, posting a yearly average gain of 13.5% over the period.
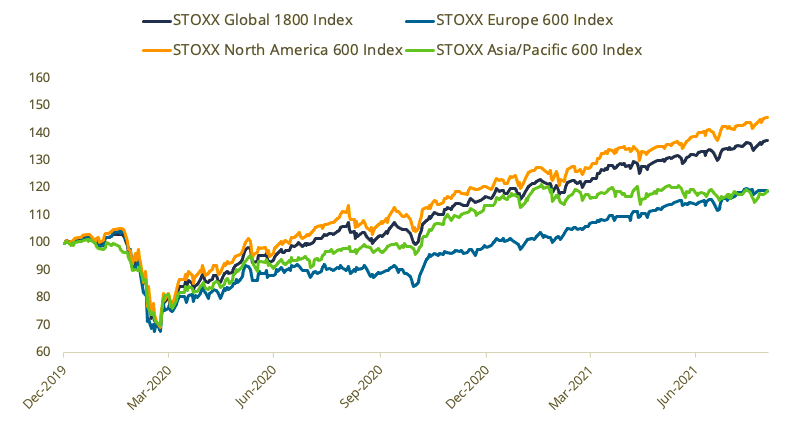
Figure 2 – Returns since Jan. 1, 2020
Investors have focused on positive news from the economy and corporate profits fronts, even as markets face headwinds from new COVID-19 variants to accelerating inflation and supply-chain bottlenecks. Speaking during a virtual gathering of central bankers on Aug. 27, Chair Jay Powell indicated the Federal Reserve may scale back its asset purchases this year but didn’t suggest any changes to the central bank’s current plan to wait until 2023 to raise interest rates.
Volatility ticks lower
The EURO STOXX 50® Volatility (VSTOXX®) Index, which tracks EURO STOXX 50 options prices, fell to 18.8 at the end of last month from 20.9 in July. The index is still higher than the 10.7 record low reached in January 2020 just before the pandemic hit markets.
A higher VSTOXX reading suggests investors are paying up for puts that offer insurance against stock price drops. The index climbed to 86 in March 2020 as many countries imposed restrictions on work and everyday activities.
Developed and emerging markets
All but two of 25 developed markets tracked by STOXX advanced during August when measured in dollars. The STOXX® Developed Markets 2400 Index climbed 2.5% in dollars and 3% in euros.
Eighteen of the 21 national developing markets rose in the month when measured in dollars. The STOXX® Emerging Markets 1500 Index rose 3.8% in dollars and 4.2% in euros.
Media on top, Basic Resources back to bottom
All but three of 20 Supersectors in the STOXX Global 1800 gained in the month, led by the STOXX® Global 1800 Media Index (+5.2%)3. The STOXX® Global 1800 Basic Resources Index (-4.1%) swung back to the worst rank in August after leading all Supersectors the previous month.
Investors continue to snub Value shares
Multi-Factor took the lead for a second straight month among the STOXX Factor Indices covering global markets. The STOXX® Global 1800 Ax Value Index underperformed for the third consecutive month.
Figure 3 – STOXX Factor (Global) indices’ August risk and return characteristics
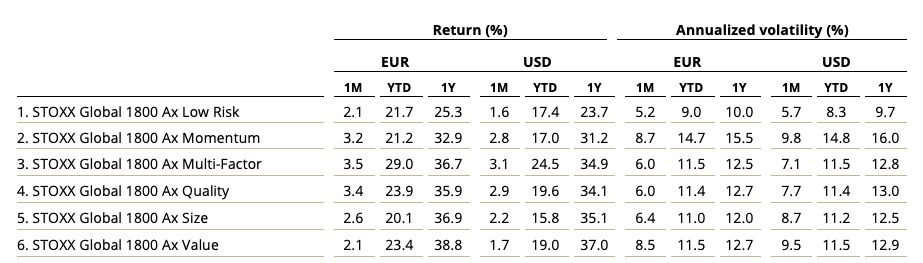
On a regional basis, gains were led by the STOXX® Europe 600 Ax Multi-Factor Index (+2.3%) and STOXX® Europe 600 Ax Quality Index (+2.3%), STOXX® USA 900 Ax Multi-Factor Index (+4.1%), and STOXX® Asia/Pacific 600 Ax Size Index (+3.6%).
The STOXX® Global 1800 ESG-X Ax Multi-Factor Index (+2.9%) and STOXX® Global 1800 ESG-X Ax Quality Index (+2.9%) led returns in August among the Global ESG-X Factor Indices. The indices apply the same factor approach as the Global Factor Indices but additionally exclude companies involved in controversial activities from a sustainability point of view.
ESG-X and ESG integration indices
The STOXX® ESG-X indices, which are versions of traditional, market-capitalization-weighted benchmarks that observe standard responsible exclusions of leading asset owners, had similar performances to benchmarks during August. The STOXX® Global 1800 ESG-X Index rose 2.6%.
Within indices that combine exclusions and ESG integration, the EURO STOXX 50® ESG Index (+2.6%) performed in line with its benchmark. The DAX® 50 ESG Index (+1.6%), which excludes companies involved in controversial activities and integrates ESG scoring into stock selection, underperformed the benchmark DAX® (+1.9%).
Sustainability indices
Among other families in the STOXX sustainability index framework, the STOXX® Global 1800 ESG Broad Market Index (+2.5%) matched its benchmark’s return. The STOXX ESG Broad Market Indices apply a set of compliance, product involvement and ESG performance exclusionary screens on a starting benchmark universe until only the 80% top ESG-rated constituents remain. Companies that are non-compliant based on the Sustainalytics Global Standards Screening assessment or are involved in controversial weapons are not eligible for selection. Additional filters exclude companies involved in tobacco production, thermal coal and military contracting.
Next, the STOXX® Global 1800 ESG Target Index added 2.9% in August, the EURO STOXX® ESG Target Index rose 2.4% and the DAX® ESG Target Index increased 2.2%. The STOXX and DAX ESG Target Indices seek to significantly improve the benchmark portfolio’s ESG profile, while mirroring its returns as closely as possible. The indices follow a similar initial selection methodology as the STOXX ESG Broad Market Indices. From that selection pool they implement, through a series of constraints, an optimization process to maximize the overall ESG score of the portfolio while constraining the tracking error to the benchmark.
The STOXX® Global 1800 ESG Target TE Index, meanwhile, rose 2.6% last month and the EURO STOXX® ESG Target TE Index added 2.4%. The STOXX ESG TE Indices follow a similar methodology to the ESG Target Indices, but the optimization imposes a tracking error minimization, subject to a constraint of improving the ESG score of the resulting portfolio.
Finally, the STOXX® Global 1800 SRI Index climbed 2.5%. The STOXX SRI indices apply a rigorous set of carbon emission intensity, compliance and involvement screens, and track the best ESG performers in each industry group within a selection of STOXX benchmarks. In the month that ended, the SRI indices produced returns that topped those of benchmarks.
Climate benchmarks
There were strong performances from the STOXX Paris-Aligned Benchmark Indices (PABs) and the STOXX Climate Transition Benchmark Indices (CTBs) covering the global and US markets. The STOXX® Global 1800 PAB Index and the STOXX® Global 1800 CTB Index both gained 2.9%. The indices were introduced last year and follow the requirements outlined by the European Commission’s Technical Expert Group (TEG) on climate benchmarks.
Among the STOXX Low Carbon Indices, the EURO STOXX 50® Low Carbon Index (+2.2%) underperformed the EURO STOXX 50 by 46 basis points last month. Elsewhere, the STOXX® Global Climate Change Leaders Index (+3.7%), which selects corporate leaders that are publicly committed to reducing their carbon footprint, returned 120 basis points more than the STOXX Global 1800 Index.
Thematic investing shows mixed relative returns
The STOXX® Thematic Indices had mixed performances last month. The indices seek exposure to the economic upside of disruptive global megatrends and follow two approaches: revenue-based and artificial-intelligence-driven.
The iSTOXX® Developed Markets B.R.AI.N. Index beat all other revenue-based thematic indices after gaining 5%. The index is comprised of companies that are exposed to four megatrends: biotechnology (B), robotics (R), artificial intelligence (AI) and nanotechnology (N). At the other end, the STOXX® Global Electric Vehicles & Driving Technology Index’s 0.8% retreat was the poorest showing in the group.
All three STOXX artificial-intelligence-driven thematic indices trailed the benchmark STOXX Global 1800 Index in August. The STOXX® AI Global Artificial Intelligence Index and its ADTV5 version rose 1.4% and 1.2%, respectively, while the iSTOXX® Yewno Developed Markets Blockchain Index gained 2%.
Dividend strategies
Dividend strategies extended during August the relative weak performance of the previous two months.
The STOXX® Global Maximum Dividend 40 Index (+0.2%) selects only the highest-dividend-yielding stocks. The STOXX® Global Select Dividend 100 Index (+1%), meanwhile, tracks companies with sizeable dividends but also applies a quality filter such as a history of stable payments. The STOXX® Global ESG-X Select Dividend 100 Index (+1%) was introduced last February and targets the highest-yielding stocks within universes screened for responsible investment criteria.
The STOXX® Global Select 100 EUR Index, which blends increasing dividend yields with low volatility and is calculated in euros, advanced 1.7%.
Minimum variance
The STOXX Minimum Variance Indices come in two versions. A constrained version has similar exposure to its market-capitalization-weighted benchmark but with lower risk. The unconstrained version, on the other hand, has more freedom to fulfill its minimum variance mandate within the same universe of stocks.
Minimum variance strategies had particularly weak returns in US markets last month, relative to the benchmark. The STOXX® USA 900 Minimum Variance Index rose 1.8%, while its unconstrained version climbed only 1.1%. The STOXX® Europe 600 Minimum Variance Index added 1.9% while the STOXX® Europe 600 Minimum Variance Unconstrained Index increased 1.5%
1 All results are total returns before taxes unless specified.
2 Throughout the article, all European indices are quoted in euros, while global, North America, US, Japan and Asia/Pacific indices are in dollars.
3 Figures in parentheses denote last month’s gross returns.


